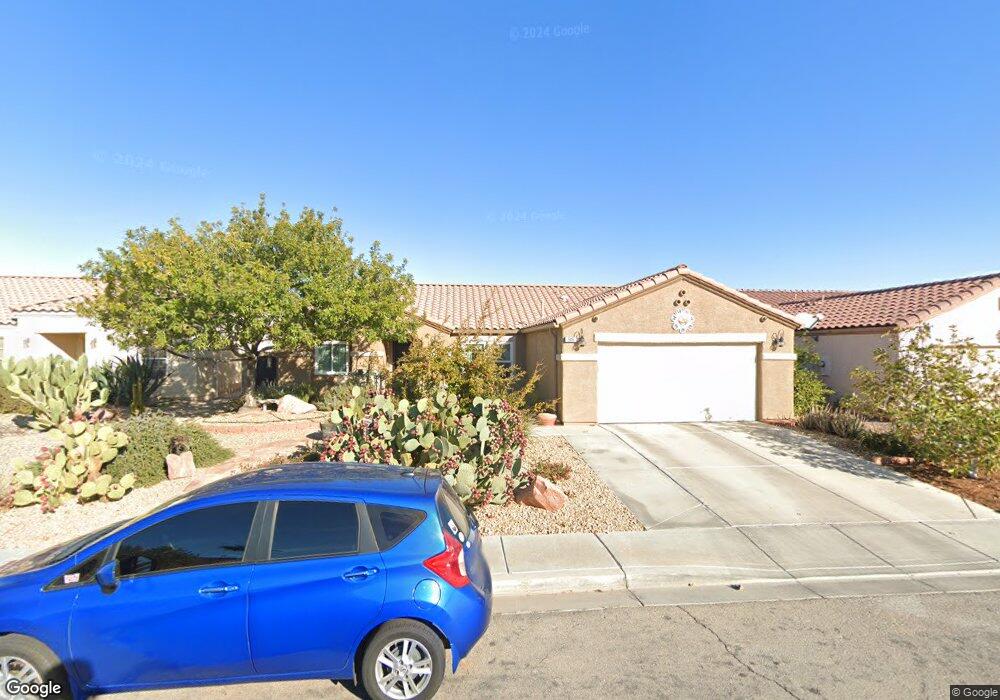
546 Green Gables Ave Las Vegas, NV 89183
Silverado Ranch NeighborhoodEstimated Value: $439,105 - $496,000
3
Beds
2
Baths
1,725
Sq Ft
$275/Sq Ft
Est. Value
About This Home
This home is located at 546 Green Gables Ave, Las Vegas, NV 89183 and is currently estimated at $473,526, approximately $274 per square foot. 546 Green Gables Ave is a home located in Clark County with nearby schools including John R. Hummel Elementary School, Charles Silvestri Junior High School, and Liberty High School.
Ownership History
Date
Name
Owned For
Owner Type
Purchase Details
Closed on
Feb 12, 2015
Sold by
Benedict Scott and Benedict Michelle
Bought by
Four Kids Living Trust
Current Estimated Value
Purchase Details
Closed on
Apr 1, 2003
Sold by
Stanio Arnold M and Stanio Julie
Bought by
Benedict Scott and Benedict Michelle
Home Financials for this Owner
Home Financials are based on the most recent Mortgage that was taken out on this home.
Original Mortgage
$32,500
Interest Rate
5.54%
Purchase Details
Closed on
Nov 17, 1999
Sold by
Kaufman & Broad Of Nevada Inc
Bought by
Stanio Arnold M and Stanio Julie
Home Financials for this Owner
Home Financials are based on the most recent Mortgage that was taken out on this home.
Original Mortgage
$134,049
Interest Rate
7.82%
Mortgage Type
FHA
Create a Home Valuation Report for This Property
The Home Valuation Report is an in-depth analysis detailing your home's value as well as a comparison with similar homes in the area
Home Values in the Area
Average Home Value in this Area
Purchase History
| Date | Buyer | Sale Price | Title Company |
|---|---|---|---|
| Four Kids Living Trust | -- | None Available | |
| Benedict Scott | $192,500 | Equity Title Of Nevada | |
| Stanio Arnold M | $139,991 | United Title |
Source: Public Records
Mortgage History
| Date | Status | Borrower | Loan Amount |
|---|---|---|---|
| Previous Owner | Benedict Scott | $32,500 | |
| Previous Owner | Stanio Arnold M | $134,049 |
Source: Public Records
Tax History Compared to Growth
Tax History
| Year | Tax Paid | Tax Assessment Tax Assessment Total Assessment is a certain percentage of the fair market value that is determined by local assessors to be the total taxable value of land and additions on the property. | Land | Improvement |
|---|---|---|---|---|
| 2025 | $1,730 | $110,034 | $42,000 | $68,034 |
| 2024 | $1,680 | $110,034 | $42,000 | $68,034 |
| 2023 | $1,680 | $108,956 | $44,450 | $64,506 |
| 2022 | $1,632 | $88,302 | $29,400 | $58,902 |
| 2021 | $1,584 | $83,678 | $27,650 | $56,028 |
| 2020 | $1,535 | $81,897 | $26,250 | $55,647 |
| 2019 | $1,516 | $77,864 | $23,100 | $54,764 |
| 2018 | $1,447 | $73,027 | $20,300 | $52,727 |
| 2017 | $2,131 | $72,644 | $19,250 | $53,394 |
| 2016 | $1,355 | $65,191 | $11,550 | $53,641 |
| 2015 | $1,352 | $51,788 | $11,550 | $40,238 |
| 2014 | $1,312 | $43,411 | $8,750 | $34,661 |
Source: Public Records
Map
Nearby Homes
- 506 Green Gables Ave
- 10164 Tree Bark St
- 10151 Tumbling Tree St
- 10013 Solid Lime St
- 638 Ribbon Grass Ave
- 10025 Catseye Cove Ct
- 365 Sapphire Rock Ave
- 10266 Martinsburg Ct
- 357 Whispering Tree Ave
- 10133 Rice Paper St
- 508 Candy Mint Ave
- 9801 Bradford Summit St
- 10142 Rice Paper St
- 9854 Canterbury Creek St
- 10339 Baby Bud St
- 710 Elliot Peak Ave
- 10208 Ghost Gum St
- 305 Spry Ave
- 10366 Midseason Mist St
- 10374 Baby Bud St
- 556 Green Gables Ave
- 536 Green Gables Ave
- 547 Pearberry Ave
- 537 Pearberry Ave
- 557 Pearberry Ave
- 526 Green Gables Ave
- 566 Green Gables Ave
- 545 Green Gables Ave
- 527 Pearberry Ave
- 567 Pearberry Ave
- 555 Green Gables Ave
- 535 Green Gables Ave
- 516 Green Gables Ave
- 565 Green Gables Ave
- 565 Green Gables Ave
- 576 Green Gables Ave
- 525 Green Gables Ave
- 577 Pearberry Ave
- 575 Green Gables Ave
- 515 Green Gables Ave