Estimated Value: $422,000 - $438,000
4
Beds
2
Baths
1,520
Sq Ft
$284/Sq Ft
Est. Value
About This Home
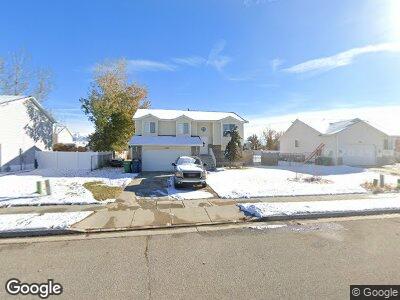
This home is located at 5464 S 4125 W, Roy, UT 84067 and is currently estimated at $430,997, approximately $283 per square foot. 5464 S 4125 W is a home located in Weber County with nearby schools including Freedom School, Roy Junior High School, and Roy High School.
Ownership History
Date
Name
Owned For
Owner Type
Purchase Details
Closed on
Mar 14, 2022
Sold by
Schultz Neil R and Schultz Debra L
Bought by
Ruiz Antonio Vega and Vega Maria Esperanza
Current Estimated Value
Home Financials for this Owner
Home Financials are based on the most recent Mortgage that was taken out on this home.
Original Mortgage
$423,193
Outstanding Balance
$398,633
Interest Rate
3.85%
Mortgage Type
FHA
Estimated Equity
$32,364
Purchase Details
Closed on
Jun 27, 2013
Sold by
Schultz Neil R and Schultz Debra L
Bought by
Schultz Neil R and Schultz Debra L
Home Financials for this Owner
Home Financials are based on the most recent Mortgage that was taken out on this home.
Original Mortgage
$102,500
Interest Rate
3.48%
Mortgage Type
New Conventional
Purchase Details
Closed on
Jan 29, 2001
Sold by
Mike Schultz Construction Inc
Bought by
Nielsen Travis C
Home Financials for this Owner
Home Financials are based on the most recent Mortgage that was taken out on this home.
Original Mortgage
$113,768
Interest Rate
7.13%
Mortgage Type
FHA
Create a Home Valuation Report for This Property
The Home Valuation Report is an in-depth analysis detailing your home's value as well as a comparison with similar homes in the area
Home Values in the Area
Average Home Value in this Area
Purchase History
| Date | Buyer | Sale Price | Title Company |
|---|---|---|---|
| Ruiz Antonio Vega | -- | Old Republic Title | |
| Schultz Neil R | -- | Metro National Title | |
| Nielsen Travis C | -- | -- |
Source: Public Records
Mortgage History
| Date | Status | Borrower | Loan Amount |
|---|---|---|---|
| Open | Ruiz Antonio Vega | $423,193 | |
| Previous Owner | Schultz Neil R | $102,500 | |
| Previous Owner | Nielsen Travis C | $113,768 |
Source: Public Records
Tax History Compared to Growth
Tax History
| Year | Tax Paid | Tax Assessment Tax Assessment Total Assessment is a certain percentage of the fair market value that is determined by local assessors to be the total taxable value of land and additions on the property. | Land | Improvement |
|---|---|---|---|---|
| 2024 | $2,566 | $225,499 | $66,007 | $159,492 |
| 2023 | $2,391 | $209,550 | $65,968 | $143,582 |
| 2022 | $2,672 | $243,650 | $57,754 | $185,896 |
| 2021 | $2,052 | $305,000 | $80,017 | $224,983 |
| 2020 | $1,980 | $271,000 | $80,017 | $190,983 |
| 2019 | $1,904 | $245,000 | $45,015 | $199,985 |
| 2018 | $1,862 | $226,000 | $42,015 | $183,985 |
| 2017 | $1,753 | $199,000 | $42,015 | $156,985 |
| 2016 | $1,646 | $100,135 | $21,415 | $78,720 |
| 2015 | $1,452 | $89,655 | $21,415 | $68,240 |
| 2014 | $1,397 | $84,878 | $18,736 | $66,142 |
Source: Public Records
Map
Nearby Homes
- 5464 S 4125 W
- 5460 S 4125 W
- 5468 S 4125 W
- 5488 S 4125 W
- 5495 Midland Dr
- 5499 Midland Dr
- 5456 S 4125 W
- 4229 W 5475 S
- 5489 Midland Dr
- 5467 S 4125 W
- 5461 S 4125 W Unit 145
- 5452 S 4125 W
- 4235 W 5475 S
- 5483 Midland Dr
- 5457 S 4125 W
- 5457 S 4125 W Unit 803
- 5494 Midland Dr Unit 2
- 5494 Midland Dr
- 5446 S 4175 W
- 5453 S 4125 W Unit 143