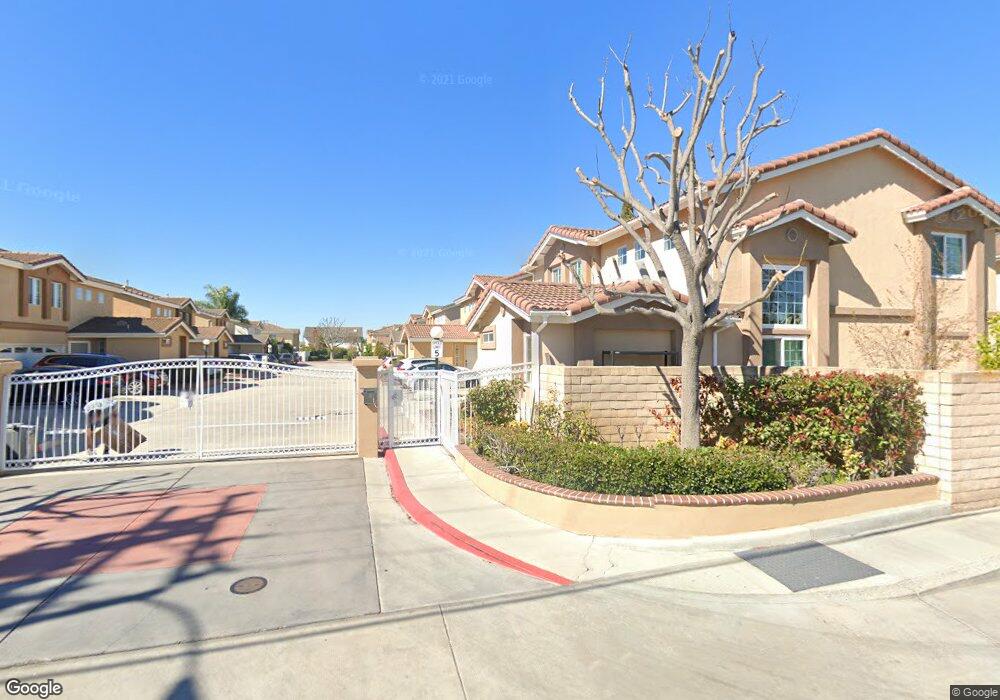
5465 Lindsey Ln Cypress, CA 90630
Estimated Value: $1,198,000 - $1,217,911
4
Beds
3
Baths
1,799
Sq Ft
$671/Sq Ft
Est. Value
About This Home
This home is located at 5465 Lindsey Ln, Cypress, CA 90630 and is currently estimated at $1,207,228, approximately $671 per square foot. 5465 Lindsey Ln is a home located in Orange County with nearby schools including Juliet Morris Elementary School, Lexington Junior High School, and Cypress High School.
Ownership History
Date
Name
Owned For
Owner Type
Purchase Details
Closed on
Oct 29, 2024
Sold by
Wasserman Stuart J and Wasserman Maria D
Bought by
Gamalath Dineth Dushan and Betrabet Rishika Chinmay
Current Estimated Value
Home Financials for this Owner
Home Financials are based on the most recent Mortgage that was taken out on this home.
Original Mortgage
$705,000
Outstanding Balance
$697,982
Interest Rate
6.12%
Mortgage Type
New Conventional
Estimated Equity
$509,246
Purchase Details
Closed on
Sep 4, 1997
Sold by
C & A Walker Homes Inc
Bought by
Wasserman Stuart J and Wasserman Maria D
Home Financials for this Owner
Home Financials are based on the most recent Mortgage that was taken out on this home.
Original Mortgage
$182,400
Interest Rate
7.23%
Create a Home Valuation Report for This Property
The Home Valuation Report is an in-depth analysis detailing your home's value as well as a comparison with similar homes in the area
Home Values in the Area
Average Home Value in this Area
Purchase History
| Date | Buyer | Sale Price | Title Company |
|---|---|---|---|
| Gamalath Dineth Dushan | $1,130,000 | Ticor Title | |
| Gamalath Dineth Dushan | $1,130,000 | Ticor Title | |
| Wasserman Stuart J | $228,000 | First American Title Ins Co |
Source: Public Records
Mortgage History
| Date | Status | Borrower | Loan Amount |
|---|---|---|---|
| Open | Gamalath Dineth Dushan | $705,000 | |
| Closed | Gamalath Dineth Dushan | $705,000 | |
| Previous Owner | Wasserman Stuart J | $182,400 |
Source: Public Records
Tax History
| Year | Tax Paid | Tax Assessment Tax Assessment Total Assessment is a certain percentage of the fair market value that is determined by local assessors to be the total taxable value of land and additions on the property. | Land | Improvement |
|---|---|---|---|---|
| 2025 | $4,267 | $1,130,000 | $863,933 | $266,067 |
| 2024 | $4,267 | $356,913 | $107,846 | $249,067 |
| 2023 | $4,169 | $349,915 | $105,731 | $244,184 |
| 2022 | $4,118 | $343,054 | $103,657 | $239,397 |
| 2021 | $4,065 | $336,328 | $101,625 | $234,703 |
| 2020 | $4,048 | $332,880 | $100,583 | $232,297 |
| 2019 | $3,938 | $326,353 | $98,610 | $227,743 |
| 2018 | $3,886 | $319,954 | $96,676 | $223,278 |
| 2017 | $3,755 | $313,681 | $94,781 | $218,900 |
| 2016 | $3,724 | $307,531 | $92,923 | $214,608 |
| 2015 | $3,696 | $302,912 | $91,527 | $211,385 |
| 2014 | $3,504 | $296,979 | $89,734 | $207,245 |
Source: Public Records
Map
Nearby Homes
- 5353 Cumberland Dr
- 5372 Harvard Way
- 5843 La Jolla Way Unit 28
- 5482 Myra Ave
- 5068 Cumberland Dr
- 9948 Del Rio Way Unit 98
- 9011 Cerise Ln Unit 129
- 9001 Cerise Ln Unit 109
- 9001 Cerise Ln Unit 113
- 6007 Clementine Ln Unit 21
- 9598 Naples Dr
- 5000 Clementine Ln
- 9332 Nancy St
- 10411 Saint Alban St
- 5342 Bishop St
- 4790 Montefino Dr
- 10441 Rexford Dr
- 9702 Juanita St
- 9432 Alderbury St
- 4644 Portofino Cir
- 5475 Lindsey Ln
- 5455 Lindsey Ln
- 5466 Plumeria Ln
- 5460 Lindsey Ln
- 5476 Plumeria Ln
- 5470 Lindsey Ln
- 5450 Lindsey Ln
- 5456 Plumeria Ln
- 5445 Lindsey Ln
- 5440 Lindsey Ln
- 5446 Plumeria Ln
- 5435 Lindsey Ln
- 5463 Plumeria Ln
- 5473 Plumeria Ln
- 5453 Plumeria Ln
- 5430 Lindsey Ln
- 5436 Plumeria Ln
- 9757 Spruce Ct
- 5443 Plumeria Ln
- 9745 Spruce Ct
Your Personal Tour Guide
Ask me questions while you tour the home.