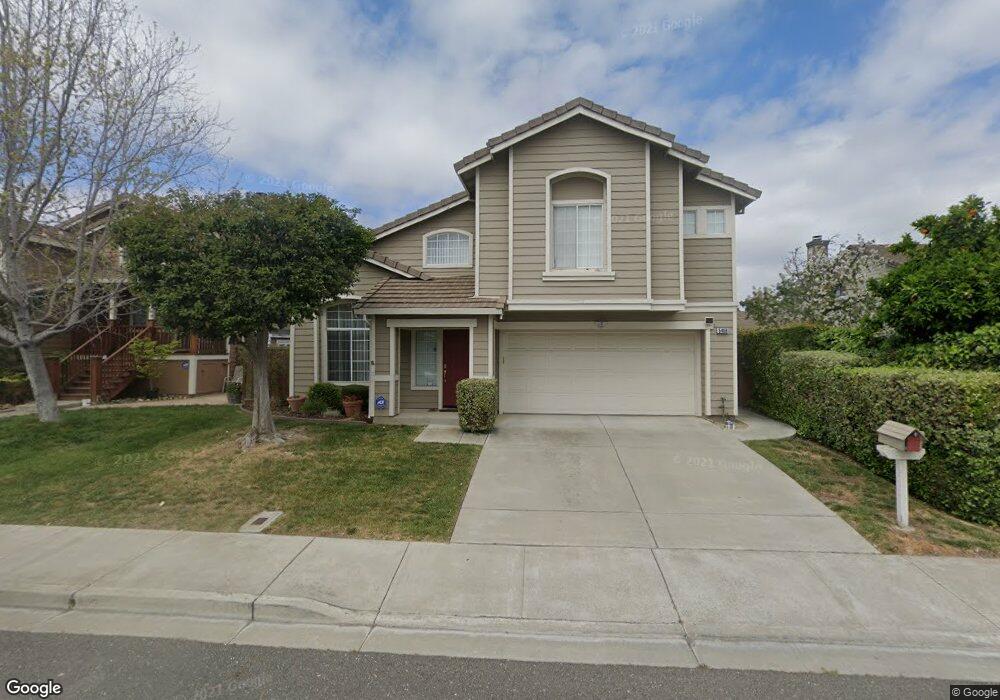
5468 Andromeda Cir Fremont, CA 94538
Blacow NeighborhoodEstimated Value: $1,605,000 - $1,713,000
4
Beds
3
Baths
1,614
Sq Ft
$1,019/Sq Ft
Est. Value
About This Home
This home is located at 5468 Andromeda Cir, Fremont, CA 94538 and is currently estimated at $1,645,212, approximately $1,019 per square foot. 5468 Andromeda Cir is a home located in Alameda County with nearby schools including Steven Millard Elementary, G.M. Walters Middle School, and John F. Kennedy High School.
Ownership History
Date
Name
Owned For
Owner Type
Purchase Details
Closed on
Oct 28, 2019
Sold by
Sezto Ip Lisa Jane and Ip Simon Chi Hung
Bought by
Ip Simon Chi Hung and Sezto Ip Lisa Jane
Current Estimated Value
Purchase Details
Closed on
Jun 9, 2000
Sold by
Allen Chao Q and Allen Timothy R
Bought by
Ip Simon C and Sezto Ip Lisa J
Home Financials for this Owner
Home Financials are based on the most recent Mortgage that was taken out on this home.
Original Mortgage
$385,600
Outstanding Balance
$134,970
Interest Rate
8.12%
Estimated Equity
$1,510,242
Purchase Details
Closed on
Feb 20, 1994
Sold by
Kaufman & Broad South Bay Inc
Bought by
Allen Chau Q and Allen Timothy R
Home Financials for this Owner
Home Financials are based on the most recent Mortgage that was taken out on this home.
Original Mortgage
$242,050
Interest Rate
6.87%
Create a Home Valuation Report for This Property
The Home Valuation Report is an in-depth analysis detailing your home's value as well as a comparison with similar homes in the area
Home Values in the Area
Average Home Value in this Area
Purchase History
| Date | Buyer | Sale Price | Title Company |
|---|---|---|---|
| Ip Simon Chi Hung | -- | None Available | |
| Ip Simon C | $482,000 | American Title Co | |
| Allen Chau Q | $269,500 | First American Title Guarant |
Source: Public Records
Mortgage History
| Date | Status | Borrower | Loan Amount |
|---|---|---|---|
| Open | Ip Simon C | $385,600 | |
| Previous Owner | Allen Chau Q | $242,050 |
Source: Public Records
Tax History Compared to Growth
Tax History
| Year | Tax Paid | Tax Assessment Tax Assessment Total Assessment is a certain percentage of the fair market value that is determined by local assessors to be the total taxable value of land and additions on the property. | Land | Improvement |
|---|---|---|---|---|
| 2025 | $9,032 | $733,780 | $222,234 | $518,546 |
| 2024 | $9,032 | $719,257 | $217,877 | $508,380 |
| 2023 | $8,788 | $712,020 | $213,606 | $498,414 |
| 2022 | $8,670 | $691,060 | $209,418 | $488,642 |
| 2021 | $8,459 | $677,377 | $205,313 | $479,064 |
| 2020 | $8,469 | $677,363 | $203,209 | $474,154 |
| 2019 | $8,373 | $664,084 | $199,225 | $464,859 |
| 2018 | $8,209 | $651,065 | $195,319 | $455,746 |
| 2017 | $7,995 | $638,302 | $191,490 | $446,812 |
| 2016 | $7,858 | $625,790 | $187,737 | $438,053 |
| 2015 | $7,752 | $616,390 | $184,917 | $431,473 |
| 2014 | $7,617 | $604,316 | $181,295 | $423,021 |
Source: Public Records
Map
Nearby Homes
- 5531 Cosmos Common Unit 116
- 5624 Chestnut Common
- 5580 Hemlock Terrace
- 5149 Roycroft Way
- 5341 Audubon Park Ct
- 40803 Blacow Rd
- 39997 Cedar Blvd Unit 153
- 4744 Bach Ct
- 39857 Pelton Terrace
- 4759 Stevenson Blvd
- 4751 Wadsworth Ct
- 4572 De Silva St
- 39965 Potrero Dr
- 4860 Bryce Canyon Park Dr
- 39943 Parada St Unit B
- 4619 Victoria Ave
- 39931 Parada St Unit A
- 40696 Robin St
- 39965 Parada St Unit A
- 6474 Buena Vista Dr Unit B
- 5488 Andromeda Cir
- 5568 Andromeda Cir
- 5528 Andromeda Cir
- 5578 Andromeda Cir
- 5448 Andromeda Cir
- 5558 Andromeda Cir
- 5588 Andromeda CI
- 5459 Andromeda Cir
- 5588 Andromeda Cir
- 5467 Andromeda Cir
- 5451 Andromeda Cir
- 5475 Andromeda Cir
- 5438 Andromeda Cir
- 5598 Andromeda Cir
- 5443 Andromeda Cir
- 5483 Andromeda Cir
- 5515 Andromeda Cir
- 40322 Marietta Dr
- 5581 Andromeda Cir
- 5523 Andromeda Cir