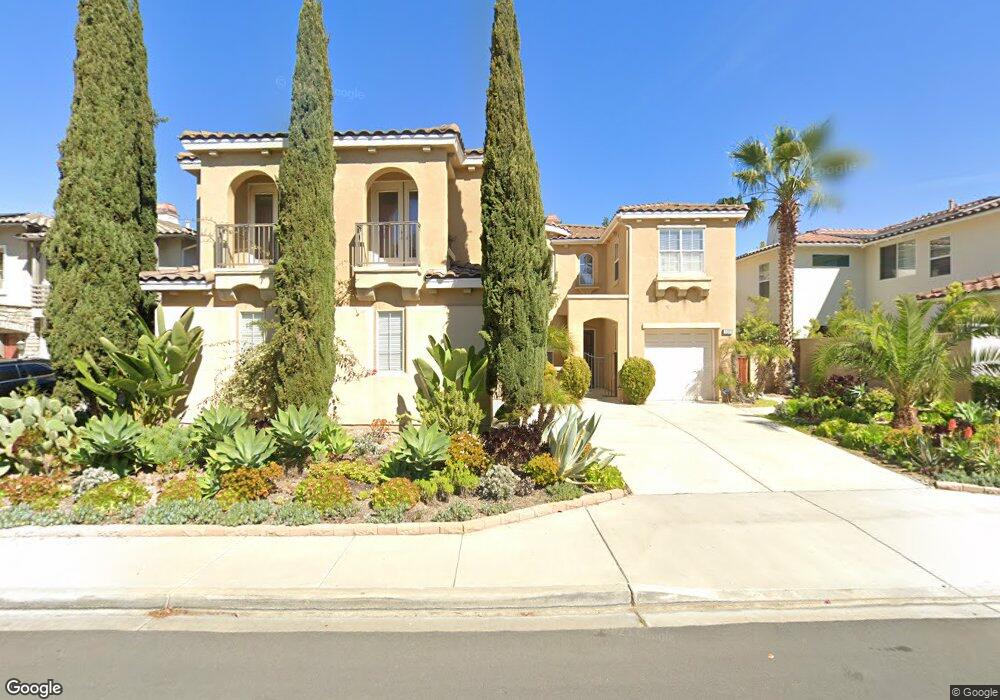
5468 Coach Ln San Diego, CA 92130
Carmel Valley NeighborhoodEstimated Value: $2,825,796 - $3,148,000
4
Beds
4
Baths
4,330
Sq Ft
$681/Sq Ft
Est. Value
About This Home
This home is located at 5468 Coach Ln, San Diego, CA 92130 and is currently estimated at $2,947,199, approximately $680 per square foot. 5468 Coach Ln is a home located in San Diego County with nearby schools including Sycamore Ridge, Pacific Trails Middle, and Torrey Pines High School.
Ownership History
Date
Name
Owned For
Owner Type
Purchase Details
Closed on
Dec 13, 2016
Sold by
Jia Charles C and Zhou Laura X
Bought by
Jia Charles C and Zhou Laura X
Current Estimated Value
Purchase Details
Closed on
Jan 29, 2002
Sold by
Zhang Xiaonan and Wu Xiaolan
Bought by
Jia Charles Chi and Zhou Laura Xiaoluo
Home Financials for this Owner
Home Financials are based on the most recent Mortgage that was taken out on this home.
Original Mortgage
$640,000
Outstanding Balance
$246,988
Interest Rate
6.12%
Estimated Equity
$2,700,211
Purchase Details
Closed on
Apr 10, 2001
Sold by
Barratt American Inc
Bought by
Zhang Xiaonan and Wu Xiaolan
Home Financials for this Owner
Home Financials are based on the most recent Mortgage that was taken out on this home.
Original Mortgage
$275,000
Interest Rate
7.14%
Create a Home Valuation Report for This Property
The Home Valuation Report is an in-depth analysis detailing your home's value as well as a comparison with similar homes in the area
Home Values in the Area
Average Home Value in this Area
Purchase History
| Date | Buyer | Sale Price | Title Company |
|---|---|---|---|
| Jia Charles C | -- | None Available | |
| Jia Charles C | -- | None Available | |
| Jia Charles Chi | $800,000 | California Title Company | |
| Zhang Xiaonan | $761,000 | First American Title |
Source: Public Records
Mortgage History
| Date | Status | Borrower | Loan Amount |
|---|---|---|---|
| Open | Jia Charles Chi | $640,000 | |
| Previous Owner | Zhang Xiaonan | $275,000 |
Source: Public Records
Tax History Compared to Growth
Tax History
| Year | Tax Paid | Tax Assessment Tax Assessment Total Assessment is a certain percentage of the fair market value that is determined by local assessors to be the total taxable value of land and additions on the property. | Land | Improvement |
|---|---|---|---|---|
| 2025 | $14,249 | $1,181,819 | $472,724 | $709,095 |
| 2024 | $14,249 | $1,158,647 | $463,455 | $695,192 |
| 2023 | $13,972 | $1,135,929 | $454,368 | $681,561 |
| 2022 | $13,770 | $1,113,657 | $445,459 | $668,198 |
| 2021 | $13,331 | $1,091,822 | $436,725 | $655,097 |
| 2020 | $13,431 | $1,080,627 | $432,247 | $648,380 |
| 2019 | $13,203 | $1,059,439 | $423,772 | $635,667 |
| 2018 | $12,702 | $1,038,666 | $415,463 | $623,203 |
| 2017 | $12,496 | $1,018,301 | $407,317 | $610,984 |
| 2016 | $12,147 | $998,335 | $399,331 | $599,004 |
| 2015 | $11,992 | $983,340 | $393,333 | $590,007 |
| 2014 | $11,782 | $964,079 | $385,629 | $578,450 |
Source: Public Records
Map
Nearby Homes
- 13120 Chambord Way
- 5582 Valerio Trail
- 5480 Valerio Trail
- 12722 Sandy Crest Ct
- 4970 Beauchamp Ct
- 5621 Shasta Daisy Trail
- 4919 Concannon Ct
- 13625 Winstanley Way
- 13016 Lumen Way
- 12932 Peppergrass Creek Gate Unit 58
- 5312 Sweetwater Trail
- 5171 Del Mar Mesa Rd
- 13033 Lamia Point Unit 217
- 5347 Morning Sage Way
- 13032 Alora Point Unit 170
- 4436 Heritage Glen Ln
- 0 Grand Del Mar Place Unit VU 8-4-5 NDP2502279
- 12436 Cavallo St
- 13165 Caminito Mendiola
- 4271 Corte Favor
- 5462 Coach Ln
- 5474 Coach Ln
- 13044 Sandown Way
- 13040 Sandown Way
- 5480 Coach Ln
- 5458 Coach Ln
- 13048 Sandown Way
- 5455 Coach Ln
- 13036 Sandown Way
- 5473 Coach Ln
- 5465 Coach Ln
- 5486 Coach Ln
- 5479 Coach Ln
- 5429 Rider Place
- 5483 Coach Ln
- 13030 Sandown Way
- 5492 Coach Ln
- 5462 Rider Place
- 13039 Sandown Way
- 13045 Sandown Way