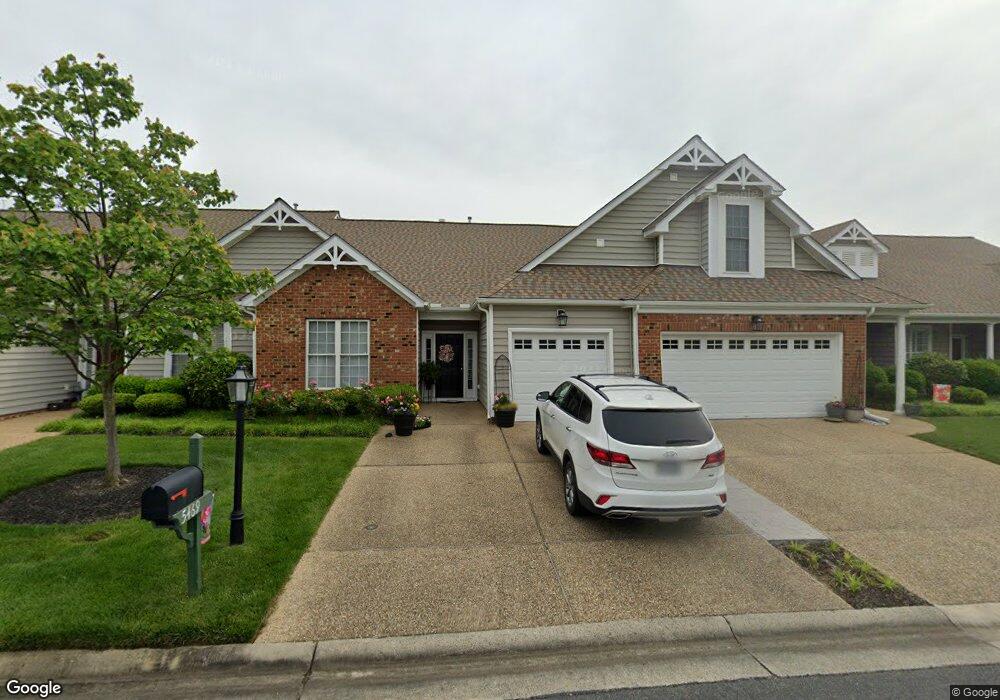
5469 Fuller Dr Unit M3 Glen Allen, VA 23059
Estimated Value: $396,000 - $421,000
2
Beds
2
Baths
1,439
Sq Ft
$282/Sq Ft
Est. Value
About This Home
This home is located at 5469 Fuller Dr Unit M3, Glen Allen, VA 23059 and is currently estimated at $405,833, approximately $282 per square foot. 5469 Fuller Dr Unit M3 is a home located in Henrico County with nearby schools including Shady Grove Elementary School, Short Pump Middle School, and Deep Run High School.
Ownership History
Date
Name
Owned For
Owner Type
Purchase Details
Closed on
Feb 16, 2024
Sold by
Miles Kay Holmes
Bought by
Felts Justin B and Felts Alicia Kay
Current Estimated Value
Home Financials for this Owner
Home Financials are based on the most recent Mortgage that was taken out on this home.
Original Mortgage
$314,000
Outstanding Balance
$308,440
Interest Rate
6.6%
Mortgage Type
New Conventional
Estimated Equity
$97,393
Purchase Details
Closed on
Aug 5, 2015
Sold by
Miles Margaret H
Bought by
Miles Kay Holmes
Purchase Details
Closed on
Sep 17, 2010
Sold by
Deutsche Bank Nat Trust Co
Bought by
Miles Margaret H
Purchase Details
Closed on
Apr 20, 2004
Sold by
Prospect Homes Of Richmon
Bought by
Juhasz Carol
Home Financials for this Owner
Home Financials are based on the most recent Mortgage that was taken out on this home.
Original Mortgage
$197,955
Interest Rate
5.4%
Mortgage Type
New Conventional
Create a Home Valuation Report for This Property
The Home Valuation Report is an in-depth analysis detailing your home's value as well as a comparison with similar homes in the area
Home Values in the Area
Average Home Value in this Area
Purchase History
| Date | Buyer | Sale Price | Title Company |
|---|---|---|---|
| Felts Justin B | $398,500 | Appomattox Title | |
| Felts Justin B | $398,500 | Appomattox Title | |
| Miles Kay Holmes | -- | -- | |
| Miles Margaret H | $182,000 | -- | |
| Juhasz Carol | $219,950 | -- |
Source: Public Records
Mortgage History
| Date | Status | Borrower | Loan Amount |
|---|---|---|---|
| Open | Felts Justin B | $314,000 | |
| Closed | Felts Justin B | $314,000 | |
| Previous Owner | Juhasz Carol | $197,955 |
Source: Public Records
Tax History Compared to Growth
Tax History
| Year | Tax Paid | Tax Assessment Tax Assessment Total Assessment is a certain percentage of the fair market value that is determined by local assessors to be the total taxable value of land and additions on the property. | Land | Improvement |
|---|---|---|---|---|
| 2025 | $3,305 | $352,400 | $74,000 | $278,400 |
| 2024 | $3,305 | $352,400 | $74,000 | $278,400 |
| 2023 | $2,995 | $352,400 | $74,000 | $278,400 |
| 2022 | $2,462 | $289,700 | $74,000 | $215,700 |
| 2021 | $2,458 | $282,500 | $70,000 | $212,500 |
| 2020 | $2,458 | $282,500 | $70,000 | $212,500 |
| 2019 | $2,161 | $248,400 | $70,000 | $178,400 |
| 2018 | $2,134 | $245,300 | $70,000 | $175,300 |
| 2017 | $2,134 | $245,300 | $70,000 | $175,300 |
| 2016 | $2,099 | $241,300 | $66,000 | $175,300 |
| 2015 | $987 | $241,300 | $66,000 | $175,300 |
| 2014 | $987 | $226,800 | $58,000 | $168,800 |
Source: Public Records
Map
Nearby Homes
- 6573 Glenshaw Dr
- 5604 Ashton Park Ct
- 5525 Barnsley Terrace
- 5824 Ketterley Row
- 12012 Layton Dr
- 12009 Club Commons Dr
- 12024 Stonewick Place
- 6225 Kershaw Dr
- 5835 Shady Hills Way
- 6233 Kershaw Dr
- 10605 Gate House Ct
- 11900 Westcott Ridge Terrace
- 5707 Stoneacre Ct
- 6209 Winsted Ct
- 12309 Hardwick Ct
- 12516 Collinstone Ct
- 5156 Farmount Terrace
- 0 Manakin Rd Unit VAGO2000320
- 11012 Ellis Meadows Ln
- 12109 Oxford Landing Dr Unit 104
- 5469 Fuller Dr
- 5469 Fuller Dr Unit na
- 5473 Fuller Dr Unit M-4
- 5473 Fuller Dr
- 5473 Fuller Dr Unit n/a
- 5465 Fuller Dr
- 5465 Fuller Dr Unit M2
- 5477 Fuller Dr
- 5477 Fuller Dr Unit M5
- 5461 Fuller Dr
- 5461 Fuller Dr
- 5461 Fuller Dr Unit M1
- 5440 Ridgedale Dr
- 5440 Ridgedale Dr
- 5440 Ridgedale Dr Unit 3
- 5440 Ridgedale Dr Unit 3 N
- 5444 Ridgedale Dr
- 5444 Ridgedale Dr
- 5444 Ridgedale Dr Unit 5444
- 5444 Ridgedale Dr Unit 2