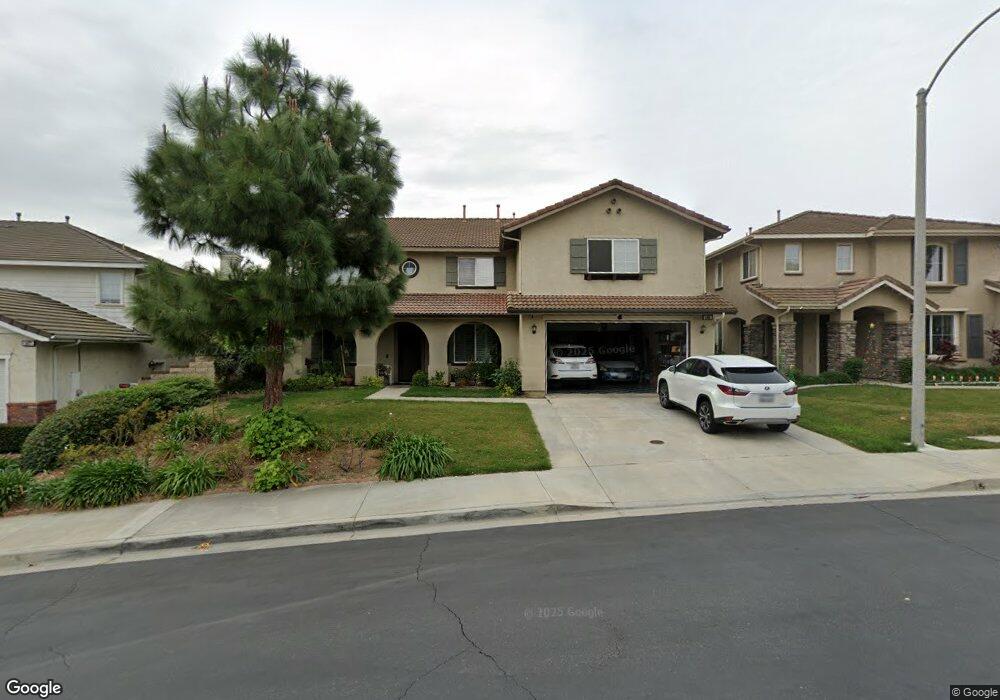
5469 Pine Ave Chino Hills, CA 91709
South Chino Hills NeighborhoodEstimated Value: $1,370,088 - $1,568,000
6
Beds
4
Baths
3,552
Sq Ft
$410/Sq Ft
Est. Value
About This Home
This home is located at 5469 Pine Ave, Chino Hills, CA 91709 and is currently estimated at $1,455,522, approximately $409 per square foot. 5469 Pine Ave is a home located in San Bernardino County with nearby schools including Michael G. Wickman Elementary School, Robert O. Townsend Junior High School, and Chino Hills High School.
Ownership History
Date
Name
Owned For
Owner Type
Purchase Details
Closed on
Jun 21, 2016
Sold by
Ladiong Doris Banagao
Bought by
Ladiong Doris Banagao and Doris Ladiong Trust
Current Estimated Value
Purchase Details
Closed on
Sep 26, 2002
Sold by
Standard Pacific Corp
Bought by
Ladiong Doris B
Home Financials for this Owner
Home Financials are based on the most recent Mortgage that was taken out on this home.
Original Mortgage
$395,400
Interest Rate
6.03%
Create a Home Valuation Report for This Property
The Home Valuation Report is an in-depth analysis detailing your home's value as well as a comparison with similar homes in the area
Home Values in the Area
Average Home Value in this Area
Purchase History
| Date | Buyer | Sale Price | Title Company |
|---|---|---|---|
| Ladiong Doris Banagao | -- | None Available | |
| Ladiong Doris B | $494,500 | First American |
Source: Public Records
Mortgage History
| Date | Status | Borrower | Loan Amount |
|---|---|---|---|
| Previous Owner | Ladiong Doris B | $395,400 |
Source: Public Records
Tax History Compared to Growth
Tax History
| Year | Tax Paid | Tax Assessment Tax Assessment Total Assessment is a certain percentage of the fair market value that is determined by local assessors to be the total taxable value of land and additions on the property. | Land | Improvement |
|---|---|---|---|---|
| 2025 | $9,826 | $744,877 | $214,356 | $530,521 |
| 2024 | $9,826 | $730,272 | $210,153 | $520,119 |
| 2023 | $9,568 | $715,953 | $206,032 | $509,921 |
| 2022 | $9,485 | $701,915 | $201,992 | $499,923 |
| 2021 | $9,299 | $688,152 | $198,031 | $490,121 |
| 2020 | $9,166 | $681,095 | $196,000 | $485,095 |
| 2019 | $9,092 | $667,740 | $192,157 | $475,583 |
| 2018 | $8,922 | $654,647 | $188,389 | $466,258 |
| 2017 | $8,774 | $641,811 | $184,695 | $457,116 |
| 2016 | $8,283 | $629,227 | $181,074 | $448,153 |
| 2015 | $8,130 | $619,775 | $178,354 | $441,421 |
| 2014 | $7,983 | $607,634 | $174,860 | $432,774 |
Source: Public Records
Map
Nearby Homes
- 16848 Morning Glory Ct
- 17004 Viana Dr
- 16631 Sagebrush St
- 16629 Quail Country Ave
- 17065 Branco Dr
- 5185 Highview St
- 17028 Barcelos Dr
- 16694 Tourmaline St
- 16731 Swift Fox Ave
- 16675 Bear Creek Ave
- 5176 Glenview St
- 4949 Highview St
- 16433 Garnet Way
- 4936 Highview St
- 17204 Guarda Dr
- 5575 Veronese Dr
- 17185 Guarda Dr
- 5142 Cellini Dr
- 17168 Penacova St
- 17435 Kelsey Way