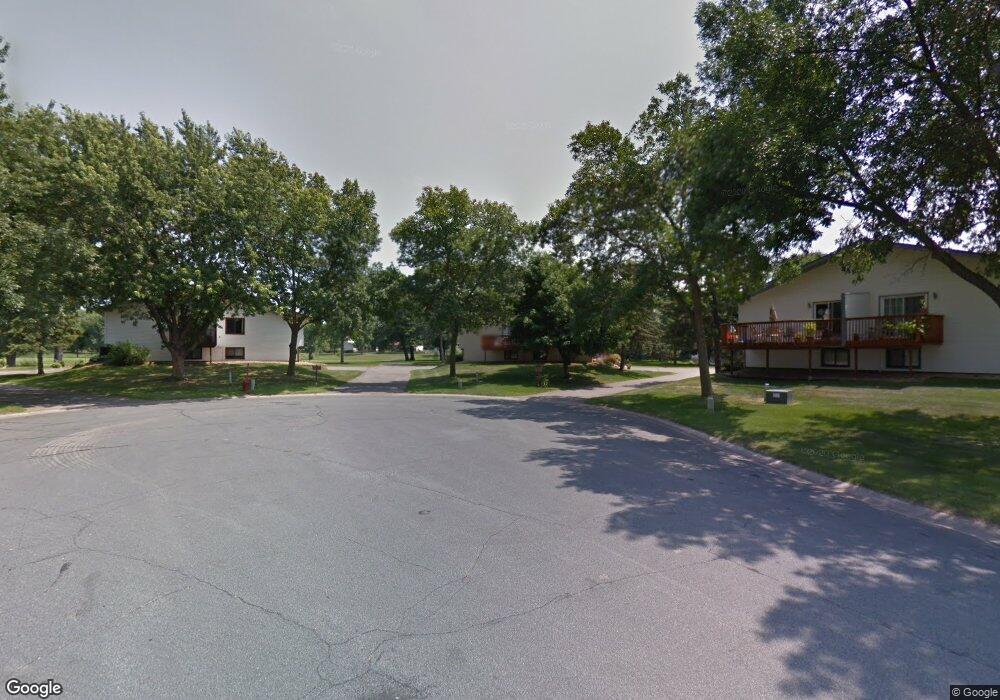
547 98th Ave NE Minneapolis, MN 55434
Estimated Value: $254,000 - $262,595
3
Beds
2
Baths
1,044
Sq Ft
$249/Sq Ft
Est. Value
About This Home
This home is located at 547 98th Ave NE, Minneapolis, MN 55434 and is currently estimated at $259,649, approximately $248 per square foot. 547 98th Ave NE is a home located in Anoka County with nearby schools including Northpoint Elementary School, Westwood Intermediate and Middle School, and Paladin Career & Technical High School.
Ownership History
Date
Name
Owned For
Owner Type
Purchase Details
Closed on
Mar 24, 2017
Sold by
Tart Joseph R and Tart Deena M
Bought by
Buzzell Debbie Margaret
Current Estimated Value
Home Financials for this Owner
Home Financials are based on the most recent Mortgage that was taken out on this home.
Original Mortgage
$150,350
Outstanding Balance
$28,154
Interest Rate
4.16%
Mortgage Type
Stand Alone Second
Estimated Equity
$231,495
Purchase Details
Closed on
Mar 31, 2005
Sold by
Zerpp Enrique D and Deering Zerpp Audra M
Bought by
Bartz Deena M
Purchase Details
Closed on
Dec 19, 2002
Sold by
Reid Jennifer L and Reid John T
Bought by
Zerpp Enrique D and Deering Zerpp Audra M
Purchase Details
Closed on
May 13, 1999
Sold by
Best Nancy K
Bought by
Peet Jennifer
Create a Home Valuation Report for This Property
The Home Valuation Report is an in-depth analysis detailing your home's value as well as a comparison with similar homes in the area
Home Values in the Area
Average Home Value in this Area
Purchase History
| Date | Buyer | Sale Price | Title Company |
|---|---|---|---|
| Buzzell Debbie Margaret | $160,000 | Midland Title | |
| Bartz Deena M | $165,500 | -- | |
| Zerpp Enrique D | $150,000 | -- | |
| Peet Jennifer | $92,400 | -- |
Source: Public Records
Mortgage History
| Date | Status | Borrower | Loan Amount |
|---|---|---|---|
| Open | Buzzell Debbie Margaret | $150,350 | |
| Closed | Buzzell Debbie Margaret | $150,350 |
Source: Public Records
Tax History Compared to Growth
Tax History
| Year | Tax Paid | Tax Assessment Tax Assessment Total Assessment is a certain percentage of the fair market value that is determined by local assessors to be the total taxable value of land and additions on the property. | Land | Improvement |
|---|---|---|---|---|
| 2025 | $2,349 | $245,500 | $70,000 | $175,500 |
| 2024 | $2,349 | $232,000 | $55,000 | $177,000 |
| 2023 | $2,060 | $227,200 | $51,400 | $175,800 |
| 2022 | $1,965 | $218,700 | $42,000 | $176,700 |
| 2021 | $1,919 | $184,600 | $33,000 | $151,600 |
| 2020 | $1,727 | $177,800 | $33,000 | $144,800 |
| 2019 | $1,574 | $156,600 | $28,800 | $127,800 |
| 2018 | $1,476 | $142,100 | $0 | $0 |
| 2017 | $1,594 | $131,600 | $0 | $0 |
| 2016 | $1,616 | $115,000 | $0 | $0 |
| 2015 | $1,485 | $115,000 | $21,900 | $93,100 |
| 2014 | -- | $88,000 | $7,800 | $80,200 |
Source: Public Records
Map
Nearby Homes
- 583 97th Ln NE
- 484 98th Ln NE
- 9896 Clover Leaf Pkwy NE
- 9872 7th St NE
- 379 95th Ln NE
- 10011 Pleasure Creek Cir NE
- 403 Pleasure Creek Dr
- 9806 Able St NE
- 111 96th Ln NE
- 782 101st Ave NE
- 877 96th Ave NE
- 10070 Tyler St NE
- 10200 Pleasure Creek Pkwy W
- 10248 Washington Ct NE
- 10252 Jackson St NE
- 10007 Tyler St NE
- 917 94th Ave NE
- 10000 Fillmore St NE Unit 66
- 9926 Fillmore St NE
- 211 92nd Ave NE
- 563 98th Ave NE
- 555 98th Ave NE
- 571 98th Ave NE
- 579 98th Ave NE
- 531 98th Ave NE
- 539 98th Ave NE
- 587 98th Ave NE
- 578 98th Ave NE
- 515 98th Ave NE
- 523 98th Ave NE
- 586 98th Ave NE
- 543 97th Ln NE
- 527 97th Ln NE
- 559 97th Ln NE
- 535 97th Ln NE
- 535 535 97th-Lane-ne
- 519 97th Ln NE
- 554 98th Ave NE
- 551 97th Ln NE
- 562 98th Ave NE