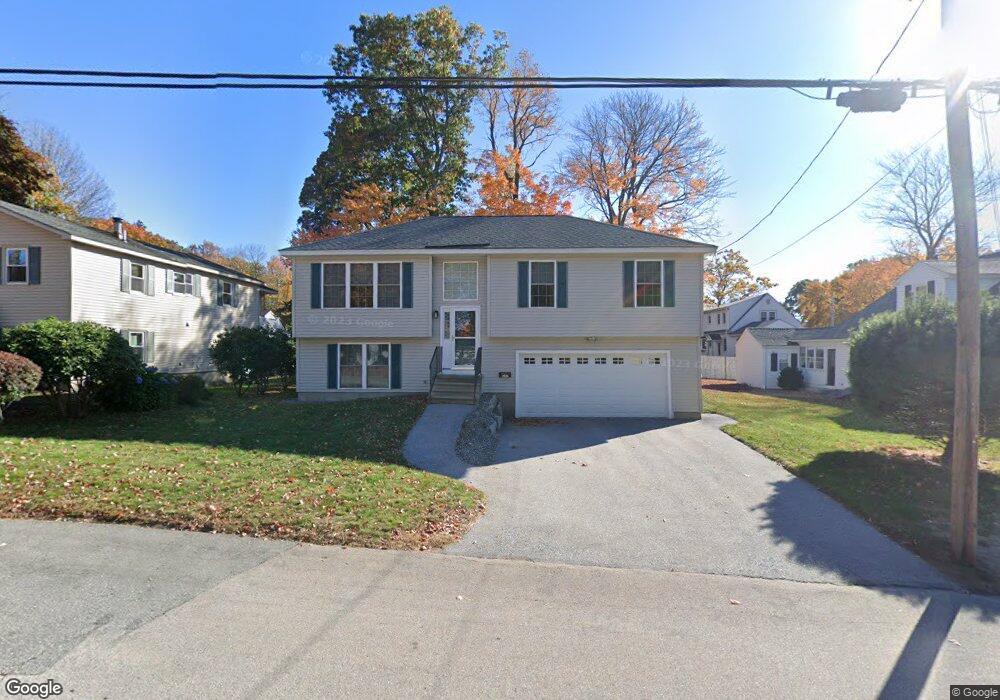
547 Blodget St Manchester, NH 03104
Straw-Smyth NeighborhoodEstimated Value: $483,000 - $532,000
3
Beds
2
Baths
1,138
Sq Ft
$449/Sq Ft
Est. Value
About This Home
This home is located at 547 Blodget St, Manchester, NH 03104 and is currently estimated at $510,982, approximately $449 per square foot. 547 Blodget St is a home with nearby schools including Smyth Road School, Hillside Middle School, and Manchester Central High School.
Ownership History
Date
Name
Owned For
Owner Type
Purchase Details
Closed on
Nov 14, 2011
Sold by
Kenney Wayne E
Bought by
Beaulieu Pierrette L and Beaulieu Richard R
Current Estimated Value
Home Financials for this Owner
Home Financials are based on the most recent Mortgage that was taken out on this home.
Original Mortgage
$172,500
Outstanding Balance
$117,571
Interest Rate
4.01%
Estimated Equity
$393,411
Purchase Details
Closed on
Jul 1, 2011
Sold by
Hunkins Frank A
Bought by
Kenney Wayne E
Create a Home Valuation Report for This Property
The Home Valuation Report is an in-depth analysis detailing your home's value as well as a comparison with similar homes in the area
Home Values in the Area
Average Home Value in this Area
Purchase History
| Date | Buyer | Sale Price | Title Company |
|---|---|---|---|
| Beaulieu Pierrette L | $230,000 | -- | |
| Kenney Wayne E | $71,000 | -- |
Source: Public Records
Mortgage History
| Date | Status | Borrower | Loan Amount |
|---|---|---|---|
| Open | Kenney Wayne E | $172,500 |
Source: Public Records
Tax History Compared to Growth
Tax History
| Year | Tax Paid | Tax Assessment Tax Assessment Total Assessment is a certain percentage of the fair market value that is determined by local assessors to be the total taxable value of land and additions on the property. | Land | Improvement |
|---|---|---|---|---|
| 2024 | $7,286 | $372,100 | $113,700 | $258,400 |
| 2023 | $7,018 | $372,100 | $113,700 | $258,400 |
| 2022 | $6,787 | $372,100 | $113,700 | $258,400 |
| 2021 | $6,579 | $372,100 | $113,700 | $258,400 |
| 2020 | $6,333 | $256,800 | $78,400 | $178,400 |
| 2019 | $6,245 | $256,800 | $78,400 | $178,400 |
| 2018 | $6,081 | $256,800 | $78,400 | $178,400 |
| 2017 | $5,989 | $256,800 | $78,400 | $178,400 |
| 2016 | $5,942 | $256,800 | $78,400 | $178,400 |
| 2015 | $5,851 | $249,600 | $71,900 | $177,700 |
| 2014 | $5,866 | $249,600 | $71,900 | $177,700 |
| 2013 | $5,658 | $249,600 | $71,900 | $177,700 |
Source: Public Records
Map
Nearby Homes