Estimated Value: $515,000 - $540,000
4
Beds
4
Baths
2,699
Sq Ft
$197/Sq Ft
Est. Value
About This Home
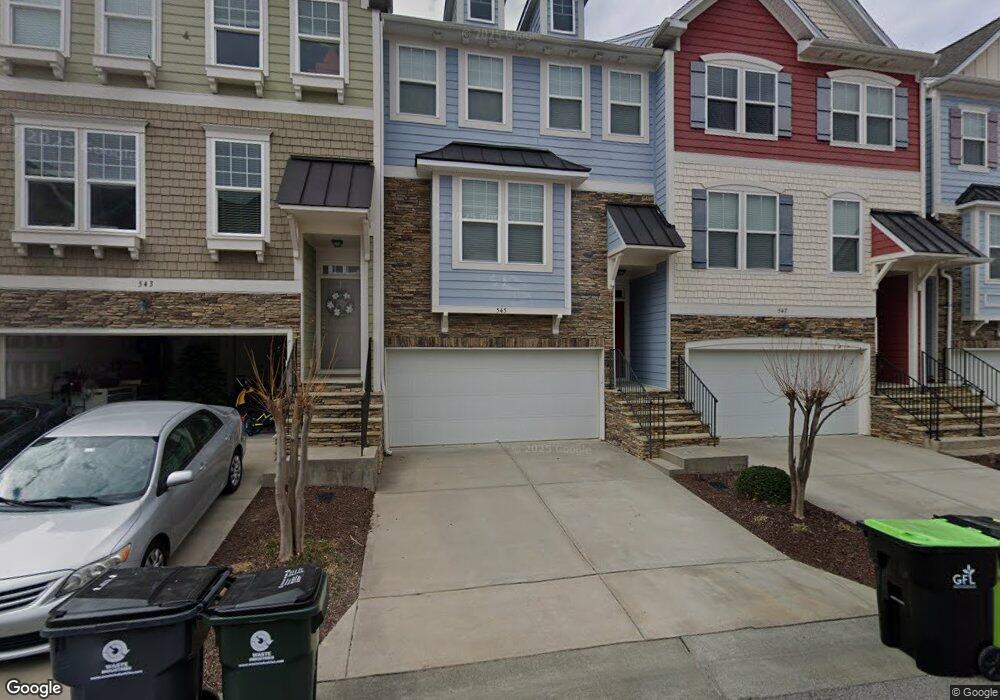
This home is located at 547 Metro Station Unit 10, Apex, NC 27502 and is currently estimated at $531,377, approximately $196 per square foot. 547 Metro Station Unit 10 is a home located in Wake County with nearby schools including Apex Elementary School, Apex Middle, and Apex High School.
Ownership History
Date
Name
Owned For
Owner Type
Purchase Details
Closed on
Dec 3, 2020
Sold by
King John and Preston Benjamin
Bought by
Stevens Matt and Stevens Amanda
Current Estimated Value
Home Financials for this Owner
Home Financials are based on the most recent Mortgage that was taken out on this home.
Original Mortgage
$352,500
Outstanding Balance
$314,390
Interest Rate
2.8%
Mortgage Type
New Conventional
Estimated Equity
$216,987
Purchase Details
Closed on
Dec 29, 2017
Sold by
Rtreu Homes
Bought by
Kinhg John
Home Financials for this Owner
Home Financials are based on the most recent Mortgage that was taken out on this home.
Original Mortgage
$301,410
Interest Rate
3.9%
Mortgage Type
New Conventional
Purchase Details
Closed on
Dec 21, 2016
Sold by
North Carolina Ii L P
Bought by
True Homes Llc
Home Financials for this Owner
Home Financials are based on the most recent Mortgage that was taken out on this home.
Original Mortgage
$180,000
Interest Rate
3.94%
Mortgage Type
Unknown
Create a Home Valuation Report for This Property
The Home Valuation Report is an in-depth analysis detailing your home's value as well as a comparison with similar homes in the area
Home Values in the Area
Average Home Value in this Area
Purchase History
| Date | Buyer | Sale Price | Title Company |
|---|---|---|---|
| Stevens Matt | $375,000 | None Available | |
| Kinhg John | $335,000 | None Available | |
| True Homes Llc | $410,500 | None Available |
Source: Public Records
Mortgage History
| Date | Status | Borrower | Loan Amount |
|---|---|---|---|
| Open | Stevens Matt | $352,500 | |
| Previous Owner | Kinhg John | $301,410 | |
| Previous Owner | True Homes Llc | $180,000 |
Source: Public Records
Tax History Compared to Growth
Tax History
| Year | Tax Paid | Tax Assessment Tax Assessment Total Assessment is a certain percentage of the fair market value that is determined by local assessors to be the total taxable value of land and additions on the property. | Land | Improvement |
|---|---|---|---|---|
| 2025 | $4,322 | $492,764 | $110,000 | $382,764 |
| 2024 | $4,226 | $492,764 | $110,000 | $382,764 |
| 2023 | $3,782 | $342,921 | $86,000 | $256,921 |
| 2022 | $3,550 | $342,921 | $86,000 | $256,921 |
| 2021 | $3,415 | $342,921 | $86,000 | $256,921 |
| 2020 | $3,381 | $342,921 | $86,000 | $256,921 |
| 2019 | $3,498 | $306,255 | $80,000 | $226,255 |
| 2018 | $3,295 | $306,255 | $80,000 | $226,255 |
| 2017 | $796 | $80,000 | $80,000 | $0 |
Source: Public Records
Map
Nearby Homes
- 547 Grand Central Station
- 596 Grand Central Station
- 1000 Oakgate Ct
- 903 Norwood Ln
- 1115 Platform Dr
- 1111 Platform Dr
- 309 Culvert St
- 311 Culvert St
- 635 Sawcut Ln
- 631 Sawcut Ln
- 633 Sawcut Ln
- 202 W Chatham St
- 105 Cunningham St
- 4006 New Yarmouth Way
- 953 Ambergate Station
- 996 Tender Dr
- 506 W Chatham St
- 919 Branch Line Ln
- 307 S Elm St
- 295 Williams Grove Ln Unit Lot 67
- 547 Metro Station
- 545 Metro Station Unit 9
- 549 Metro Station Unit 11
- 549 Metro Station
- 543 Metro Station
- 553 Metro Station
- 541 Metro Station Unit 7
- 555 Metro Station
- 539 Metro Station
- 539 Metro Station Unit 6
- 557 Metro Station
- 554 Metro Station Unit 68
- 535 Metro Station
- 535 Metro Station Unit 5
- 546 Metro Station Unit 79
- 546 Metro Station
- 544 Metro Station Unit 80
- 544 Metro Station
- 542 Metro Station
- 561 Metro Station