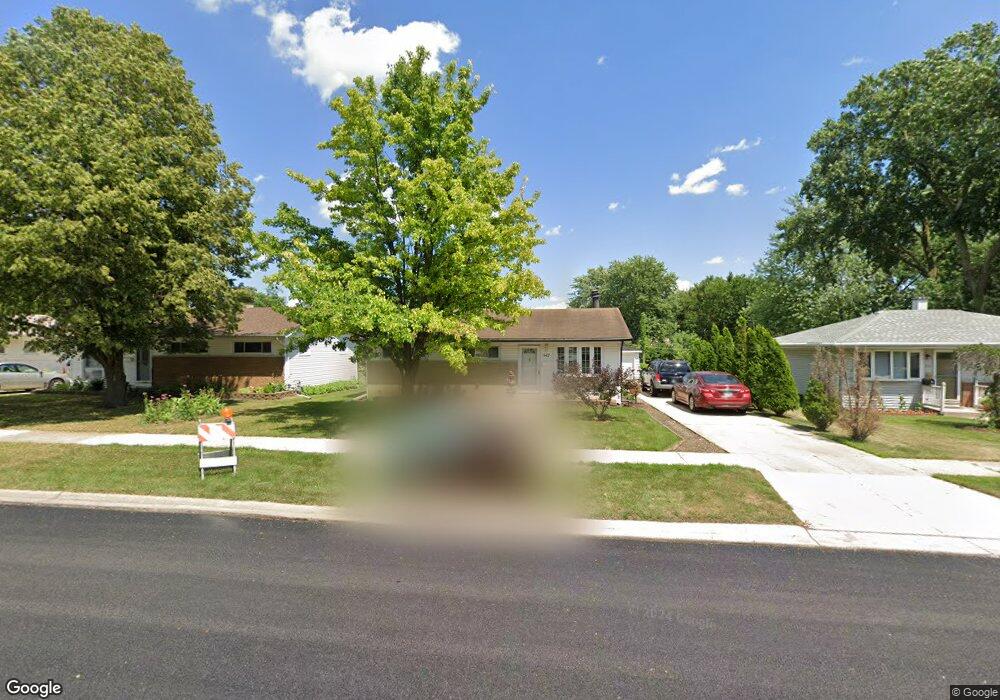
547 S Clarendon Ave Addison, IL 60101
Estimated Value: $288,252 - $338,000
--
Bed
--
Bath
972
Sq Ft
$324/Sq Ft
Est. Value
About This Home
This home is located at 547 S Clarendon Ave, Addison, IL 60101 and is currently estimated at $315,063, approximately $324 per square foot. 547 S Clarendon Ave is a home located in DuPage County with nearby schools including Ardmore Elementary School, Indian Trail Jr High School, and Addison Trail High School.
Ownership History
Date
Name
Owned For
Owner Type
Purchase Details
Closed on
Aug 31, 2005
Sold by
Tapia Carlos and Tapia Norma
Bought by
Gonzalez Hector and Hernandez Lourdes
Current Estimated Value
Home Financials for this Owner
Home Financials are based on the most recent Mortgage that was taken out on this home.
Original Mortgage
$177,600
Outstanding Balance
$104,616
Interest Rate
7.5%
Mortgage Type
Fannie Mae Freddie Mac
Estimated Equity
$210,447
Purchase Details
Closed on
Feb 24, 2000
Sold by
Hud
Bought by
Tapia Carlos and Tapia Norma
Home Financials for this Owner
Home Financials are based on the most recent Mortgage that was taken out on this home.
Original Mortgage
$114,520
Interest Rate
8.43%
Mortgage Type
FHA
Create a Home Valuation Report for This Property
The Home Valuation Report is an in-depth analysis detailing your home's value as well as a comparison with similar homes in the area
Home Values in the Area
Average Home Value in this Area
Purchase History
| Date | Buyer | Sale Price | Title Company |
|---|---|---|---|
| Gonzalez Hector | $222,000 | Heritage Title Co | |
| Tapia Carlos | -- | Stewart Title Company |
Source: Public Records
Mortgage History
| Date | Status | Borrower | Loan Amount |
|---|---|---|---|
| Open | Gonzalez Hector | $177,600 | |
| Previous Owner | Tapia Carlos | $114,520 |
Source: Public Records
Tax History Compared to Growth
Tax History
| Year | Tax Paid | Tax Assessment Tax Assessment Total Assessment is a certain percentage of the fair market value that is determined by local assessors to be the total taxable value of land and additions on the property. | Land | Improvement |
|---|---|---|---|---|
| 2024 | $4,854 | $76,875 | $35,462 | $41,413 |
| 2023 | $4,613 | $70,670 | $32,600 | $38,070 |
| 2022 | $4,292 | $64,270 | $30,610 | $33,660 |
| 2021 | $4,104 | $61,560 | $29,320 | $32,240 |
| 2020 | $3,983 | $58,960 | $28,080 | $30,880 |
| 2019 | $3,947 | $56,690 | $27,000 | $29,690 |
| 2018 | $3,609 | $50,460 | $20,770 | $29,690 |
| 2017 | $3,505 | $48,230 | $19,850 | $28,380 |
| 2016 | $3,391 | $44,530 | $18,330 | $26,200 |
| 2015 | $3,284 | $41,130 | $16,930 | $24,200 |
| 2014 | $3,610 | $44,370 | $17,450 | $26,920 |
| 2013 | $3,542 | $45,280 | $17,810 | $27,470 |
Source: Public Records
Map
Nearby Homes
- 2N000 Vista Ave
- 433 W Diversey Ave
- 18 S Vista Ave
- 10 N Adams Dr
- 18W308 Sidney Ave
- 426 W Fullerton Ave
- 921 N Grace St
- 621 W Natalie Ln
- 2N152 Wisconsin Ave
- 625 S Yale Ave
- 539 W Rose Ave
- 200 Addison Rd
- 427 W Natoma Ave
- 343 E North Ave
- 737 Saint Johns Place
- 2 N Wisconsin Ave
- 542 W Memory Ln
- 768 W St Johns Place
- 18W570 W North Ave
- 1018 N Princeton Ave
- 541 S Clarendon Ave
- 551 S Clarendon Ave
- 535 S Clarendon Ave
- 408 W Winthrop Ave
- 531 S Clarendon Ave
- 538 S Adeline Ave
- 555 S Clarendon Ave
- 544 S Adeline Ave
- 534 S Adeline Ave
- 536 S Clarendon Ave
- 527 S Clarendon Ave
- 542 S Adeline Ave
- 350 W Winthrop Ave
- 402 W Winthrop Ave
- 554 S Clarendon Ave
- 532 S Clarendon Ave
- 548 S Clarendon Ave
- 542 S Clarendon Ave
- 552 S Clarendon Ave
- 580 S Clarendon Ave