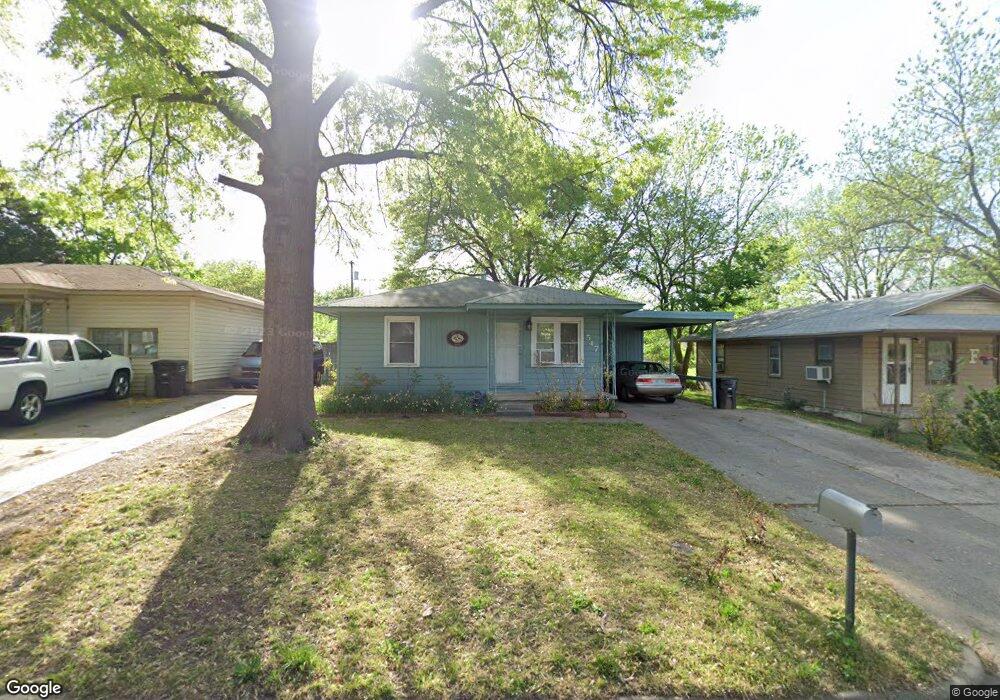
547 SE Elmhurst Ave Bartlesville, OK 74006
Estimated Value: $81,000 - $109,000
3
Beds
1
Bath
984
Sq Ft
$101/Sq Ft
Est. Value
About This Home
This home is located at 547 SE Elmhurst Ave, Bartlesville, OK 74006 and is currently estimated at $98,916, approximately $100 per square foot. 547 SE Elmhurst Ave is a home located in Washington County with nearby schools including Ranch Heights Elementary School, Madison Middle School, and Bartlesville High School.
Ownership History
Date
Name
Owned For
Owner Type
Purchase Details
Closed on
Oct 23, 2024
Sold by
Levi M Thetford Trust and Thetford Levi M
Bought by
Boggess Bethany Noelle and Boggess Austin Gale
Current Estimated Value
Purchase Details
Closed on
Aug 21, 2024
Sold by
Rodriguez Josefa Adriana
Bought by
Rodriguez Josefa Adriana and Mason Earl
Purchase Details
Closed on
Aug 20, 2024
Sold by
Mason Earl and Mason Lavelma Mae
Bought by
Rodriguez Josefa Adriana
Purchase Details
Closed on
Feb 6, 2013
Sold by
Mason Earl and Mason Lavelma Mae
Bought by
Mason Earl and Mason Lavelma Mae
Purchase Details
Closed on
Dec 14, 2010
Sold by
Bac Home Loans Servicing Lp
Bought by
Mason Earl
Purchase Details
Closed on
Jul 19, 2010
Sold by
Deason James L
Bought by
Bac Home Loans Servicing Lp and Countrywide Home Loans Servicing Lp
Purchase Details
Closed on
Feb 20, 2002
Sold by
Brewer Berl M & Lucy E Trust
Create a Home Valuation Report for This Property
The Home Valuation Report is an in-depth analysis detailing your home's value as well as a comparison with similar homes in the area
Home Values in the Area
Average Home Value in this Area
Purchase History
| Date | Buyer | Sale Price | Title Company |
|---|---|---|---|
| Boggess Bethany Noelle | -- | None Listed On Document | |
| Rodriguez Josefa Adriana | -- | None Listed On Document | |
| Rodriguez Josefa Adriana | -- | None Listed On Document | |
| Mason Earl | -- | None Available | |
| Mason Earl | $21,102 | -- | |
| Bac Home Loans Servicing Lp | -- | -- | |
| -- | $27,500 | -- |
Source: Public Records
Tax History Compared to Growth
Tax History
| Year | Tax Paid | Tax Assessment Tax Assessment Total Assessment is a certain percentage of the fair market value that is determined by local assessors to be the total taxable value of land and additions on the property. | Land | Improvement |
|---|---|---|---|---|
| 2025 | $530 | $4,549 | $706 | $3,843 |
| 2024 | $530 | $4,417 | $686 | $3,731 |
| 2023 | $530 | $4,207 | $676 | $3,531 |
| 2022 | $480 | $4,207 | $676 | $3,531 |
| 2021 | $448 | $3,816 | $620 | $3,196 |
| 2020 | $436 | $3,635 | $594 | $3,041 |
| 2019 | $416 | $3,461 | $569 | $2,892 |
| 2018 | $394 | $3,296 | $536 | $2,760 |
| 2017 | $384 | $3,139 | $505 | $2,634 |
| 2016 | $343 | $2,990 | $476 | $2,514 |
| 2015 | $332 | $2,848 | $448 | $2,400 |
| 2014 | $331 | $2,848 | $448 | $2,400 |
Source: Public Records
Map
Nearby Homes
- 4709 Amherst Dr
- 4701 Dartmouth Dr
- 4732 Cornell Dr
- 4507 E Frank Phillips Blvd
- 644 SE Elmhurst Ave
- 4512 E Frank Phillips Blvd
- 4800 E Frank Phillips Blvd
- 4900 E Frank Phillips Blvd
- 332 Brookline Place
- 397 Fleetwood Dr
- 0 SE Adams Rd Unit 2541155
- 366 SE Wilshire Ave
- 953 Yale Dr
- 4917 Amherst Dr
- 4916 Cornell Dr
- 348 SE Elmhurst Ave
- 4944 Cornell Dr
- 1000 Meadow Dr
- 328 SE Waverly Ave
- 5012 Allen Ct
- 551 SE Elmhurst Ave
- 543 SE Elmhurst Ave
- 539 SE Elmhurst Ave
- 552 SE Elmhurst Ave
- 544 SE Elmhurst Ave
- 559 SE Elmhurst Ave
- 535 SE Elmhurst Ave
- 556 SE Elmhurst Ave
- 540 SE Wilshire Ave
- 540 SE Elmhurst Ave
- 548 SE Elmhurst Ave
- 544 SE Wilshire Ave
- 558 SE Elmhurst Ave
- 532 SE Wilshire Ave
- 563 SE Elmhurst Ave
- 536 SE Elmhurst Ave
- 531 SE Elmhurst Ave
- 548 SE Wilshire Ave
- 564 SE Elmhurst Ave
- 528 SE Wilshire Ave