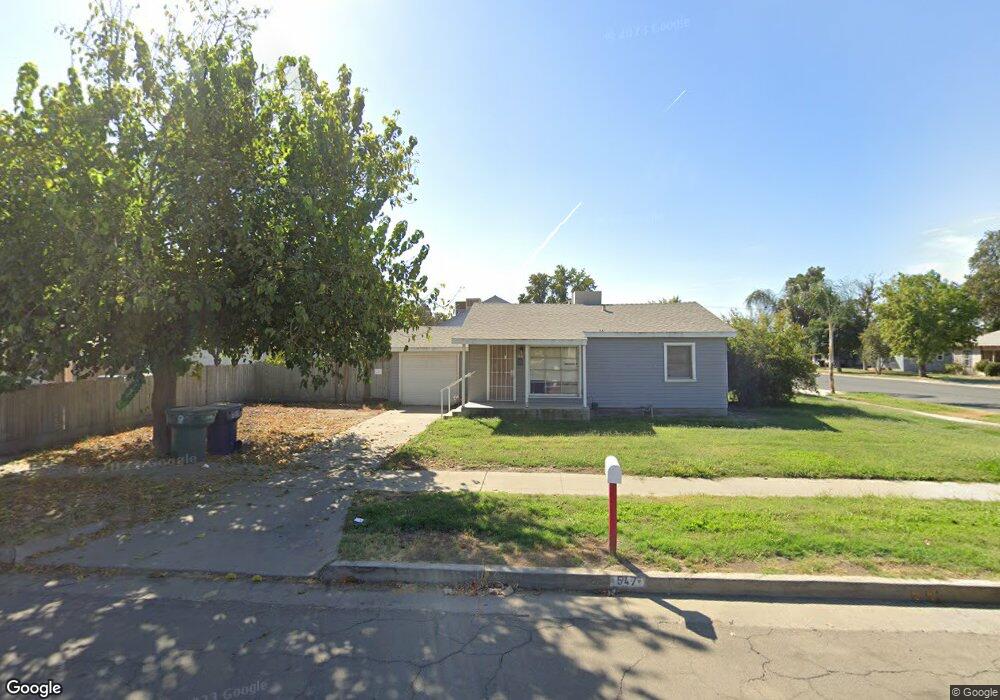
547 W Kern Ave Tulare, CA 93274
Estimated Value: $190,127 - $228,000
2
Beds
1
Bath
857
Sq Ft
$247/Sq Ft
Est. Value
About This Home
This home is located at 547 W Kern Ave, Tulare, CA 93274 and is currently estimated at $211,532, approximately $246 per square foot. 547 W Kern Ave is a home located in Tulare County with nearby schools including Maple Elementary School, Mulcahy Middle School, and Tulare Western High School.
Ownership History
Date
Name
Owned For
Owner Type
Purchase Details
Closed on
May 26, 2023
Sold by
Muncy Kelly J and Muncy Renae M
Bought by
2023 Muncy Family Trust
Current Estimated Value
Purchase Details
Closed on
Sep 4, 2012
Sold by
Muncy Jack B
Bought by
Muncy Kelly J and Muncy Renae M
Purchase Details
Closed on
Sep 1, 2011
Sold by
Bank Of The Sierra
Bought by
Muncy Jack B
Purchase Details
Closed on
Aug 15, 2011
Sold by
Madrid Ruben
Bought by
Bank Of The Sierra
Purchase Details
Closed on
Dec 12, 2002
Sold by
Azera John C
Bought by
Madrid Ruben and Madrid Elizabeth
Create a Home Valuation Report for This Property
The Home Valuation Report is an in-depth analysis detailing your home's value as well as a comparison with similar homes in the area
Home Values in the Area
Average Home Value in this Area
Purchase History
| Date | Buyer | Sale Price | Title Company |
|---|---|---|---|
| 2023 Muncy Family Trust | -- | None Listed On Document | |
| Muncy Kelly J | -- | None Available | |
| Muncy Jack B | $35,000 | Chicago Title Company | |
| Muncy Jack B | -- | Chicago Title Company | |
| Bank Of The Sierra | $41,691 | Stewart Title Of California | |
| Madrid Ruben | $7,500 | -- |
Source: Public Records
Tax History Compared to Growth
Tax History
| Year | Tax Paid | Tax Assessment Tax Assessment Total Assessment is a certain percentage of the fair market value that is determined by local assessors to be the total taxable value of land and additions on the property. | Land | Improvement |
|---|---|---|---|---|
| 2025 | $478 | $43,958 | $18,839 | $25,119 |
| 2024 | $478 | $43,097 | $18,470 | $24,627 |
| 2023 | $466 | $42,253 | $18,108 | $24,145 |
| 2022 | $453 | $41,425 | $17,753 | $23,672 |
| 2021 | $447 | $40,613 | $17,405 | $23,208 |
| 2020 | $454 | $40,197 | $17,227 | $22,970 |
| 2019 | $466 | $39,409 | $16,889 | $22,520 |
| 2018 | $458 | $38,636 | $16,558 | $22,078 |
| 2017 | $454 | $37,878 | $16,233 | $21,645 |
| 2016 | $434 | $37,136 | $15,915 | $21,221 |
| 2015 | $420 | $36,578 | $15,676 | $20,902 |
| 2014 | $420 | $35,862 | $15,369 | $20,493 |
Source: Public Records
Map
Nearby Homes