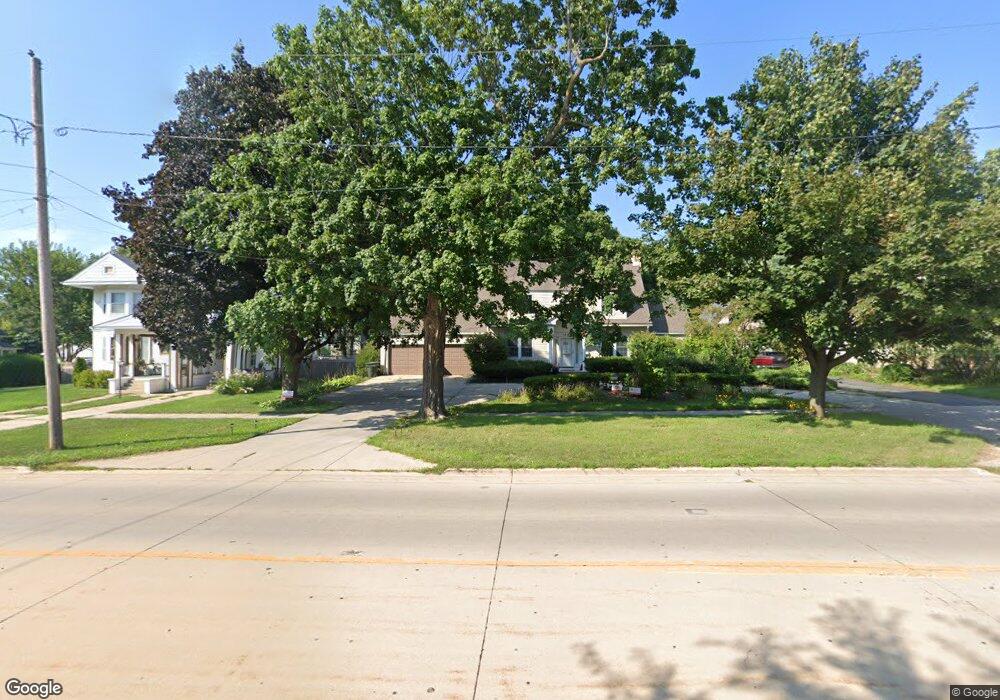
547 W State St Sycamore, IL 60178
Estimated Value: $359,000 - $463,000
5
Beds
3
Baths
3,500
Sq Ft
$115/Sq Ft
Est. Value
About This Home
This home is located at 547 W State St, Sycamore, IL 60178 and is currently estimated at $401,796, approximately $114 per square foot. 547 W State St is a home located in DeKalb County with nearby schools including Sycamore High School, Cornerstone Christian Academy, and St Mary's Catholic School.
Ownership History
Date
Name
Owned For
Owner Type
Purchase Details
Closed on
Apr 10, 2013
Sold by
Vandeburg Steven C
Bought by
Vanceburg Heather
Current Estimated Value
Purchase Details
Closed on
Aug 28, 2007
Sold by
Strand Kevin
Bought by
Vandeburg Steven and Vandeburg Heather
Home Financials for this Owner
Home Financials are based on the most recent Mortgage that was taken out on this home.
Original Mortgage
$235,000
Interest Rate
6.79%
Mortgage Type
New Conventional
Create a Home Valuation Report for This Property
The Home Valuation Report is an in-depth analysis detailing your home's value as well as a comparison with similar homes in the area
Home Values in the Area
Average Home Value in this Area
Purchase History
| Date | Buyer | Sale Price | Title Company |
|---|---|---|---|
| Vanceburg Heather | -- | -- | |
| Vandeburg Steven | $306,500 | -- |
Source: Public Records
Mortgage History
| Date | Status | Borrower | Loan Amount |
|---|---|---|---|
| Previous Owner | Vandeburg Steven | $235,000 |
Source: Public Records
Tax History Compared to Growth
Tax History
| Year | Tax Paid | Tax Assessment Tax Assessment Total Assessment is a certain percentage of the fair market value that is determined by local assessors to be the total taxable value of land and additions on the property. | Land | Improvement |
|---|---|---|---|---|
| 2024 | $9,569 | $121,096 | $22,241 | $98,855 |
| 2023 | $9,461 | $110,580 | $20,310 | $90,270 |
| 2022 | $9,043 | $101,422 | $18,628 | $82,794 |
| 2021 | $8,608 | $95,214 | $17,488 | $77,726 |
| 2020 | $8,488 | $92,873 | $17,058 | $75,815 |
| 2019 | $8,350 | $90,838 | $16,684 | $74,154 |
| 2018 | $8,208 | $88,081 | $16,178 | $71,903 |
| 2017 | $8,006 | $84,596 | $15,538 | $69,058 |
| 2016 | $7,813 | $80,737 | $14,829 | $65,908 |
| 2015 | -- | $75,988 | $13,957 | $62,031 |
| 2014 | -- | $72,156 | $13,253 | $58,903 |
| 2013 | -- | $73,539 | $13,507 | $60,032 |
Source: Public Records
Map
Nearby Homes
- 740 W State St
- 412 W Elm St
- 1936 Galloway Ct
- 1929 Galloway Ct
- Lot 1 Route 23
- 822 Dekalb Ave
- 335 North Ave
- 113 E Ottawa St
- 321 N Locust St
- 916 Albert Ave
- 211 E Ottawa St
- 732 Park Ave
- 660 South Ave
- 434 E Exchange St Unit 2
- 459 E State St
- 56 Briden Ln Unit 56
- 45 Briden Ln Unit 45
- 480 S Peace Rd
- 418 Fairway Ln
- 932 Foxpointe Dr
- 539 W State St
- 557 W State St
- 533 W State St
- 556 W State St
- 563 W State St
- 529 W State St
- 568 W State St
- 571 W State St
- 521 W State St
- 519 W State St
- 432 W Exchange St
- 432 W Exchange St
- 444 W Exchange St
- 438 W Exchange St
- 452 W Exchange St
- 452 W Exchange St
- 462 W Exchange St
- 107 S Sacramento St
- 468 W Exchange St
- 468 W Exchange St