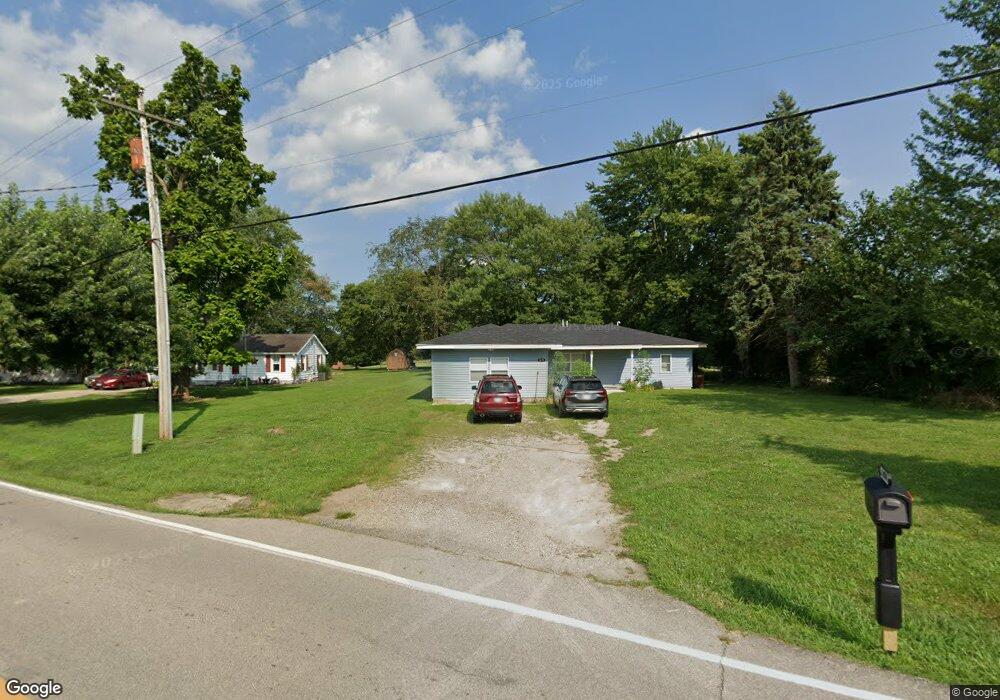
5470 Red Lion 5 Points Rd Springboro, OH 45066
Estimated Value: $154,000 - $248,000
3
Beds
1
Bath
1,300
Sq Ft
$160/Sq Ft
Est. Value
About This Home
This home is located at 5470 Red Lion 5 Points Rd, Springboro, OH 45066 and is currently estimated at $208,042, approximately $160 per square foot. 5470 Red Lion 5 Points Rd is a home located in Warren County with nearby schools including Clearcreek Elementary School, Dennis Elementary School, and Springboro Intermediate School.
Ownership History
Date
Name
Owned For
Owner Type
Purchase Details
Closed on
Oct 8, 2021
Sold by
Bailey Jeffrey E and The Jeffrey E Bailey Revocable
Bought by
Manning Lynnea and Deegan Jacob
Current Estimated Value
Home Financials for this Owner
Home Financials are based on the most recent Mortgage that was taken out on this home.
Original Mortgage
$137,750
Outstanding Balance
$125,615
Interest Rate
2.8%
Mortgage Type
New Conventional
Estimated Equity
$82,427
Purchase Details
Closed on
Mar 3, 2014
Sold by
Howard Kathryn C
Bought by
Bailey Jeffrey E and The Jeffrey E Bailey Revocable Trust
Purchase Details
Closed on
Jul 22, 1987
Sold by
Renner James W and Renner Dianna
Bought by
Howard and Howard Verl G
Create a Home Valuation Report for This Property
The Home Valuation Report is an in-depth analysis detailing your home's value as well as a comparison with similar homes in the area
Home Values in the Area
Average Home Value in this Area
Purchase History
| Date | Buyer | Sale Price | Title Company |
|---|---|---|---|
| Manning Lynnea | $145,000 | Accommodation | |
| Bailey Jeffrey E | $45,000 | None Available | |
| Howard | $50,000 | -- |
Source: Public Records
Mortgage History
| Date | Status | Borrower | Loan Amount |
|---|---|---|---|
| Open | Manning Lynnea | $137,750 |
Source: Public Records
Tax History Compared to Growth
Tax History
| Year | Tax Paid | Tax Assessment Tax Assessment Total Assessment is a certain percentage of the fair market value that is determined by local assessors to be the total taxable value of land and additions on the property. | Land | Improvement |
|---|---|---|---|---|
| 2024 | $1,749 | $42,640 | $18,700 | $23,940 |
| 2023 | $1,412 | $31,825 | $10,451 | $21,374 |
| 2022 | $1,412 | $31,826 | $10,451 | $21,375 |
| 2021 | $1,352 | $31,826 | $10,451 | $21,375 |
| 2020 | $1,263 | $25,876 | $8,498 | $17,378 |
| 2019 | $1,174 | $25,876 | $8,498 | $17,378 |
| 2018 | $1,163 | $25,876 | $8,498 | $17,378 |
| 2017 | $1,179 | $23,429 | $7,795 | $15,635 |
| 2016 | $1,227 | $23,429 | $7,795 | $15,635 |
| 2015 | $1,513 | $23,429 | $7,795 | $15,635 |
| 2014 | $1,513 | $27,460 | $7,020 | $20,440 |
| 2013 | $1,513 | $33,220 | $8,500 | $24,720 |
Source: Public Records
Map
Nearby Homes
- 5944 Round Hill Ct
- 6265 Red Lion 5 Points Rd
- 18 Glasgow St Unit 29
- 18 Glasgow St
- 8 Glasgow St Unit 30
- 8 Glasgow St
- 980 Heatherwoode Cir
- 70 Morris St Unit 6
- 45 Morris St Unit 15
- 45 Morris St
- 65 Morris St Unit 17
- 65 Morris St
- 25 Morris St
- 25 Morris St Unit 13
- Hampton Plan at Northampton
- Cheswicke Plan at Northampton
- Barrett Plan at Northampton
- Hyde Park Plan at Northampton
- Melville Plan at Northampton
- Cooke Plan at Northampton
- 5470 Red Lion Five Points Rd
- 5466 Red Lion 5 Points Rd
- 5462 Red Lion 5 Points Rd
- 5486 Red Lion 5 Points Rd
- 5502 Red Lion 5 Points Rd
- 5516 Red Lion 5 Points Rd
- 5483 Red Lion 5 Points Rd
- 5429 Red Lion 5 Points Rd
- 5528 Red Lion 5 Points Rd
- 5529 Red Lion 5 Points Rd
- 5411 Red Lion 5 Points Rd
- 5544 Red Lion 5 Points Rd
- 5544 Red Lion Five Points Rd
- 5556 N Route 741
- 5519 St Rt 741
- 5519 N State Route 741
- 5586 Red Lion 5 Points Rd
- 5441 N State Route 741
- 5459 N State Route 741
- 5551 N State Route 741