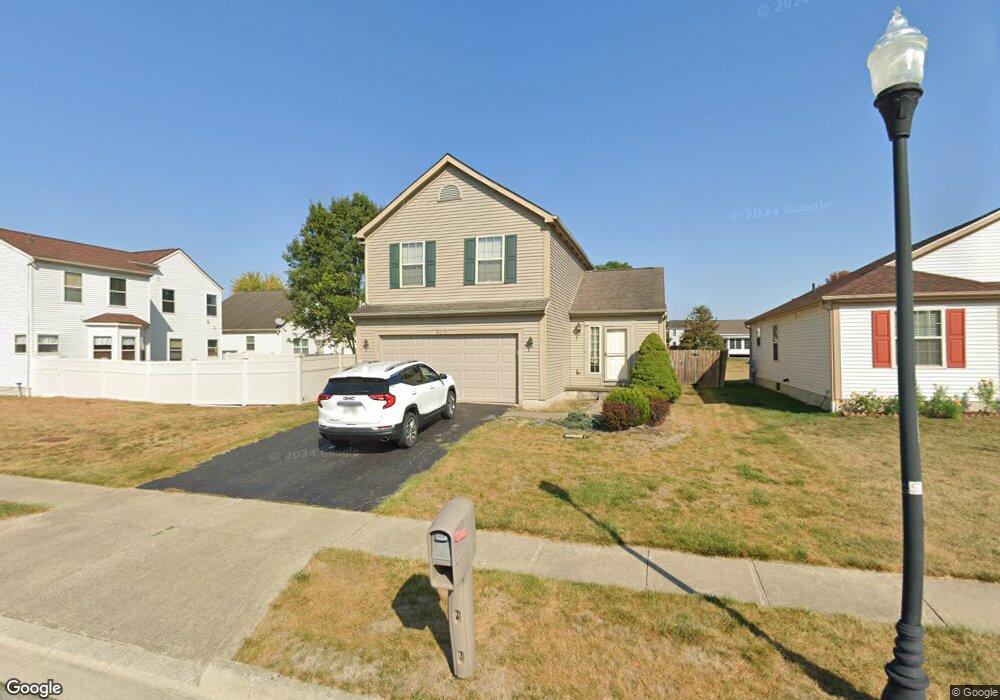
5472 Winchester Meadows Dr Canal Winchester, OH 43110
East Columbus-White Ash NeighborhoodEstimated Value: $318,000 - $340,000
3
Beds
2
Baths
1,692
Sq Ft
$193/Sq Ft
Est. Value
About This Home
This home is located at 5472 Winchester Meadows Dr, Canal Winchester, OH 43110 and is currently estimated at $326,866, approximately $193 per square foot. 5472 Winchester Meadows Dr is a home located in Franklin County with nearby schools including Winchester Trail Elementary School, Indian Trail Elementary School, and Canal Winchester Middle School.
Ownership History
Date
Name
Owned For
Owner Type
Purchase Details
Closed on
Oct 9, 2008
Sold by
Hud
Bought by
Echelbarger Gary J and Echelbarger Geanine C
Current Estimated Value
Home Financials for this Owner
Home Financials are based on the most recent Mortgage that was taken out on this home.
Original Mortgage
$126,461
Outstanding Balance
$84,094
Interest Rate
6.43%
Mortgage Type
FHA
Estimated Equity
$242,772
Purchase Details
Closed on
Jun 23, 2008
Sold by
Glenn Timothy D and Gmac Mortgage Llc
Bought by
Hud
Purchase Details
Closed on
Feb 13, 2003
Sold by
M/I Schottenstein Homes Inc
Bought by
Hysell Brenda I and Glenn Timothy D
Home Financials for this Owner
Home Financials are based on the most recent Mortgage that was taken out on this home.
Original Mortgage
$165,851
Interest Rate
6.07%
Mortgage Type
FHA
Create a Home Valuation Report for This Property
The Home Valuation Report is an in-depth analysis detailing your home's value as well as a comparison with similar homes in the area
Home Values in the Area
Average Home Value in this Area
Purchase History
| Date | Buyer | Sale Price | Title Company |
|---|---|---|---|
| Echelbarger Gary J | $125,300 | Lakeside Ti | |
| Hud | $96,000 | None Available | |
| Hysell Brenda I | $167,500 | Transohio Residential Title |
Source: Public Records
Mortgage History
| Date | Status | Borrower | Loan Amount |
|---|---|---|---|
| Open | Echelbarger Gary J | $126,461 | |
| Previous Owner | Hysell Brenda I | $165,851 |
Source: Public Records
Tax History Compared to Growth
Tax History
| Year | Tax Paid | Tax Assessment Tax Assessment Total Assessment is a certain percentage of the fair market value that is determined by local assessors to be the total taxable value of land and additions on the property. | Land | Improvement |
|---|---|---|---|---|
| 2024 | $4,890 | $101,260 | $30,450 | $70,810 |
| 2023 | $4,860 | $101,255 | $30,450 | $70,805 |
| 2022 | $5,454 | $66,820 | $13,970 | $52,850 |
| 2021 | $3,683 | $66,820 | $13,970 | $52,850 |
| 2020 | $3,669 | $66,820 | $13,970 | $52,850 |
| 2019 | $3,397 | $53,070 | $11,170 | $41,900 |
| 2018 | $3,186 | $53,070 | $11,170 | $41,900 |
| 2017 | $3,322 | $53,070 | $11,170 | $41,900 |
| 2016 | $3,050 | $45,510 | $9,070 | $36,440 |
| 2015 | $3,061 | $45,510 | $9,070 | $36,440 |
| 2014 | $3,060 | $45,510 | $9,070 | $36,440 |
| 2013 | $1,597 | $47,915 | $9,555 | $38,360 |
Source: Public Records
Map
Nearby Homes
- 5332 Wadley Ct
- 5493 Meadow Passage Dr
- 5450 Rothermund Dr
- 5480 Rothermund Dr
- 7047 Royalton Ridge Ave
- 5439 Rockhurst Dr
- 7074 Selva Trail Dr
- 5670 Orchard Lakes Trail Dr
- 7362 Winchester Cathedral Ct
- 7061 Selva Trail Dr
- 5682 Orchard Lakes Trail Dr
- 0 Lehman Rd Unit 225027581
- 0 Lehman Rd Unit 225021076
- Pendleton Plan at Orchard Lakes
- Henley Plan at Orchard Lakes
- Aldridge Plan at Orchard Lakes
- Harmony Plan at Orchard Lakes
- Freeport Plan at Orchard Lakes
- Stamford Plan at Orchard Lakes
- Sienna Plan at Orchard Lakes
- 7271 Emerald Tree Dr
- 7263 Emerald Tree Dr
- 5488 Winchester Meadows Dr
- 7279 Emerald Tree Dr
- 5496 Winchester Meadows Dr
- 7287 Emerald Tree Dr
- 5471 Sweet Gale Ct
- 7810 Sweet Meadow Dr
- 7252 Sweet Meadow Dr
- 5487 Sweet Gale Ct
- 5485 Sweet Gale Ct
- 7247 Emerald Tree Dr
- 5504 Winchester Meadows Dr
- 5509 Sweet Gale Ct
- 7295 Emerald Tree Dr
- 5495 Sweet Gale Ct
- 7244 Sweet Meadow Dr
- 7239 Emerald Tree Dr
- 5512 Winchester Meadows Dr
- 5512 Winchester Meadows Dr Unit 453