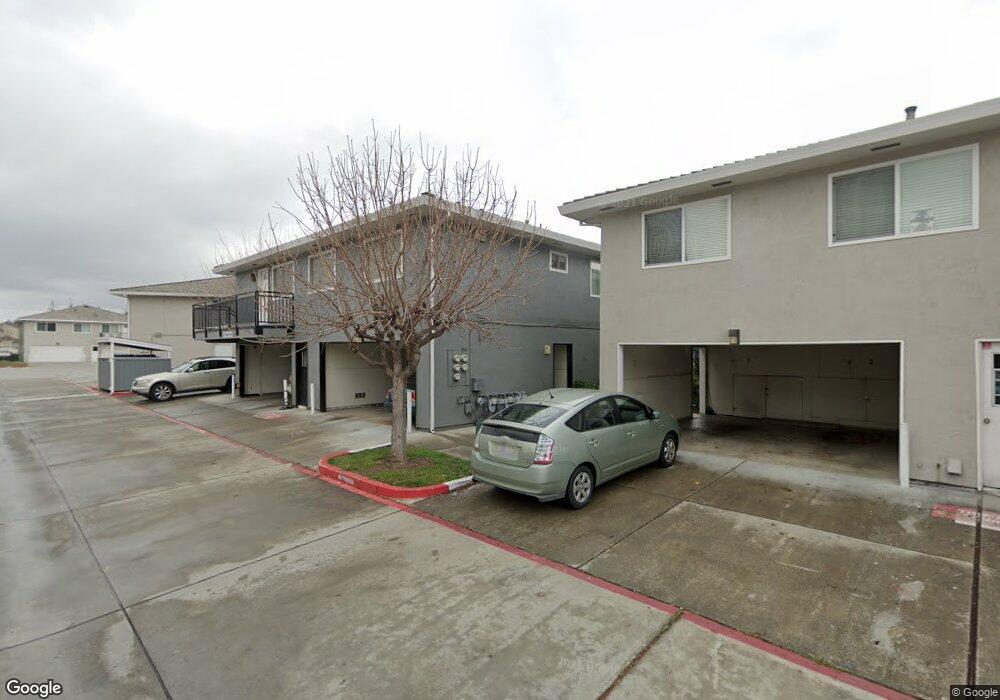
5473 Tradewinds Walkway Unit 1 San Jose, CA 95123
Oak Grove NeighborhoodEstimated Value: $500,000 - $681,000
2
Beds
1
Bath
810
Sq Ft
$674/Sq Ft
Est. Value
About This Home
This home is located at 5473 Tradewinds Walkway Unit 1, San Jose, CA 95123 and is currently estimated at $545,545, approximately $673 per square foot. 5473 Tradewinds Walkway Unit 1 is a home located in Santa Clara County with nearby schools including Hayes Elementary School, Davis (Caroline) Intermediate School, and Oak Grove High School.
Ownership History
Date
Name
Owned For
Owner Type
Purchase Details
Closed on
Oct 25, 1999
Sold by
Henriquez Genis and Moreno Edith
Bought by
Harris E Jean
Current Estimated Value
Home Financials for this Owner
Home Financials are based on the most recent Mortgage that was taken out on this home.
Original Mortgage
$160,050
Outstanding Balance
$48,289
Interest Rate
7.82%
Mortgage Type
FHA
Estimated Equity
$497,256
Purchase Details
Closed on
Aug 31, 1998
Sold by
Jose Cipriano
Bought by
Enriquez Genis and Enriquez Edith
Purchase Details
Closed on
Jul 24, 1998
Sold by
Solis Ruperto and Solis Matilde
Bought by
Cipriano Jose and Henriquez Genis
Purchase Details
Closed on
Jan 12, 1993
Sold by
Mintz Sagy Pundak and Mintz Amy L
Bought by
Cipriano Jose and Solis Ruperto
Home Financials for this Owner
Home Financials are based on the most recent Mortgage that was taken out on this home.
Original Mortgage
$86,000
Interest Rate
6.89%
Mortgage Type
FHA
Create a Home Valuation Report for This Property
The Home Valuation Report is an in-depth analysis detailing your home's value as well as a comparison with similar homes in the area
Home Values in the Area
Average Home Value in this Area
Purchase History
| Date | Buyer | Sale Price | Title Company |
|---|---|---|---|
| Harris E Jean | $165,000 | Stewart Title | |
| Enriquez Genis | -- | -- | |
| Cipriano Jose | -- | -- | |
| Cipriano Jose | $88,500 | First American Title Guarant |
Source: Public Records
Mortgage History
| Date | Status | Borrower | Loan Amount |
|---|---|---|---|
| Open | Harris E Jean | $160,050 | |
| Previous Owner | Cipriano Jose | $86,000 |
Source: Public Records
Tax History Compared to Growth
Tax History
| Year | Tax Paid | Tax Assessment Tax Assessment Total Assessment is a certain percentage of the fair market value that is determined by local assessors to be the total taxable value of land and additions on the property. | Land | Improvement |
|---|---|---|---|---|
| 2025 | $3,650 | $253,574 | $88,671 | $164,903 |
| 2024 | $3,650 | $248,603 | $86,933 | $161,670 |
| 2023 | $3,583 | $243,729 | $85,229 | $158,500 |
| 2022 | $3,578 | $238,951 | $83,558 | $155,393 |
| 2021 | $3,522 | $234,267 | $81,920 | $152,347 |
| 2020 | $3,470 | $231,866 | $81,081 | $150,785 |
| 2019 | $3,399 | $227,321 | $79,492 | $147,829 |
| 2018 | $3,376 | $222,865 | $77,934 | $144,931 |
| 2017 | $3,330 | $218,496 | $76,406 | $142,090 |
| 2016 | $3,162 | $214,212 | $74,908 | $139,304 |
| 2015 | $3,084 | $210,995 | $73,783 | $137,212 |
| 2014 | $2,910 | $206,863 | $72,338 | $134,525 |
Source: Public Records
Map
Nearby Homes
- 224 Coy Dr Unit 1
- 201 Pecan Grove Ct
- 285 Tradewinds Dr Unit 6
- 196 Coy Dr Unit 1
- 275 Tradewinds Dr Unit 11
- 291 Tradewinds Dr Unit 7
- 262 Tradewinds Ct Unit 4
- 5558 Judith St Unit 1
- 5503 Eagles Ln Unit 2
- 309 Tradewinds Dr Unit 3
- 303 Tradewinds Dr Unit 10
- 310 Tradewinds Dr Unit 8
- 236 Cheris Dr
- 5532 Spinnaker Dr Unit 2
- 5476 Sean Cir Unit 7
- 341 Blossom Hill Rd Unit 3
- 329 Blossom Hill Rd Unit 4
- 323 Blossom Hill Rd Unit 2
- 5506 Sean Cir Unit 112
- 5386 Borneo Cir
- 5473 Tradewinds Walkway Unit 3
- 5473 Tradewinds Walkway Unit 2
- 5473 Tradewinds Walkway Unit 4
- 5467 Tradewinds Ww Unit 3
- 5467 Tradewinds Walkway Unit 3
- 5467 Tradewinds Walkway Unit 4
- 5467 Tradewinds Walkway Unit 1
- 5479 Tradewinds Ww Unit 3
- 5479 Tradewinds Walkway Unit 1
- 5479 Tradewinds Walkway Unit 1
- 5479 Tradewinds Walkway Unit 2
- 5479 Tradewinds Walkway Unit 4
- 5479 Tradewinds Walkway Unit 3
- 5479 Tradewinds Walkway Unit 6901
- 5490 Judith St Unit 1
- 5490 Judith St
- 5490 Judith St Unit 4
- 5490 Judith St Unit 3
- 5490 Judith St Unit 2
- 5490 Judith St Unit 1