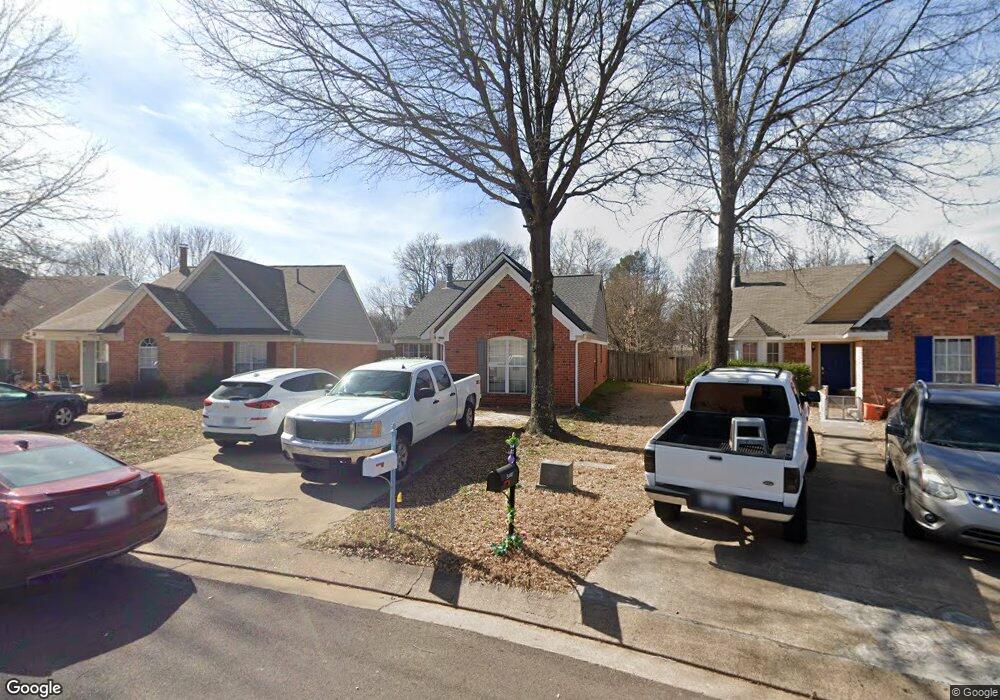
5479 Remmington Cove Southaven, MS 38671
Estimated Value: $192,000 - $202,303
2
Beds
--
Bath
1,233
Sq Ft
$161/Sq Ft
Est. Value
About This Home
This home is located at 5479 Remmington Cove, Southaven, MS 38671 and is currently estimated at $198,076, approximately $160 per square foot. 5479 Remmington Cove is a home located in DeSoto County with nearby schools including Hope Sullivan Elementary School, Southaven Intermediate School, and Southaven Middle School.
Ownership History
Date
Name
Owned For
Owner Type
Purchase Details
Closed on
Feb 12, 2024
Sold by
Walls Nancy C
Bought by
Turbyfill Jeramy Brannon and Murphy Brianna R
Current Estimated Value
Home Financials for this Owner
Home Financials are based on the most recent Mortgage that was taken out on this home.
Original Mortgage
$186,558
Outstanding Balance
$183,292
Interest Rate
6.66%
Mortgage Type
FHA
Estimated Equity
$14,784
Purchase Details
Closed on
Mar 13, 2018
Sold by
York Leeann M
Bought by
Walls Nancy C
Home Financials for this Owner
Home Financials are based on the most recent Mortgage that was taken out on this home.
Original Mortgage
$90,333
Interest Rate
4.38%
Mortgage Type
New Conventional
Purchase Details
Closed on
Nov 18, 2014
Sold by
Osborn Tina Stallcup and Osborn Dennis
Bought by
Hall Leeann M
Home Financials for this Owner
Home Financials are based on the most recent Mortgage that was taken out on this home.
Original Mortgage
$80,025
Interest Rate
4.09%
Mortgage Type
New Conventional
Create a Home Valuation Report for This Property
The Home Valuation Report is an in-depth analysis detailing your home's value as well as a comparison with similar homes in the area
Home Values in the Area
Average Home Value in this Area
Purchase History
| Date | Buyer | Sale Price | Title Company |
|---|---|---|---|
| Turbyfill Jeramy Brannon | -- | Realty Title | |
| Walls Nancy C | -- | Realty Title | |
| Hall Leeann M | -- | None Available |
Source: Public Records
Mortgage History
| Date | Status | Borrower | Loan Amount |
|---|---|---|---|
| Open | Turbyfill Jeramy Brannon | $186,558 | |
| Previous Owner | Walls Nancy C | $90,333 | |
| Previous Owner | Hall Leeann M | $80,025 |
Source: Public Records
Tax History Compared to Growth
Tax History
| Year | Tax Paid | Tax Assessment Tax Assessment Total Assessment is a certain percentage of the fair market value that is determined by local assessors to be the total taxable value of land and additions on the property. | Land | Improvement |
|---|---|---|---|---|
| 2024 | $899 | $8,232 | $2,500 | $5,732 |
| 2023 | $899 | $8,232 | $0 | $0 |
| 2022 | $874 | $8,232 | $2,500 | $5,732 |
| 2021 | $874 | $8,232 | $2,500 | $5,732 |
| 2020 | $809 | $7,774 | $2,500 | $5,274 |
| 2019 | $809 | $7,774 | $2,500 | $5,274 |
| 2017 | $835 | $13,330 | $7,915 | $5,415 |
| 2016 | $835 | $7,915 | $2,500 | $5,415 |
| 2015 | $1,127 | $13,330 | $7,915 | $5,415 |
| 2014 | $835 | $7,915 | $0 | $0 |
| 2013 | $835 | $7,915 | $0 | $0 |
Source: Public Records
Map
Nearby Homes
- 5379 Bradley Dr
- 1096 We Ross Pkwy W
- 5298 Russell Dr
- 5330 Kalian Cove
- 5353 Pollard Dr
- 672 Grant Dr
- 5448 Pollard Dr
- 5704 Westminister Ln
- 5339 Kristy Ln
- 5381 Peppermill Dr
- 0 Pepper Chase Dr
- 4900 Pepper Chase Dr
- 6275 U S Highway 51
- 1652 Thomas St
- 1664 Thomas St
- 5893 Kayla Dr
- 1784 Thomas St
- 1876 Greeno Dr
- 406 Venture Dr
- 5512 Alexandria Ln
- 5479 Remington Cove
- 5471 Remmington Cove
- 5487 Remmington Cove
- 5471 Remington Cove
- 5487 Remington Cove
- 5463 Remmington Cove
- 5463 Remington Cove
- 5493 Remington Cove
- 5493 Remmington Cove
- 5455 Remmington Cove
- 5455 Remington Cove
- 932 Remington Cove
- 932 Remmington Cove
- 5447 Remmington Cove
- 923 Remmington Cove
- 923 Remington Cove
- 924 Remmington Cove
- 924 Remington Cove
- 916 Remmington Cove
- 913 Remington Cove