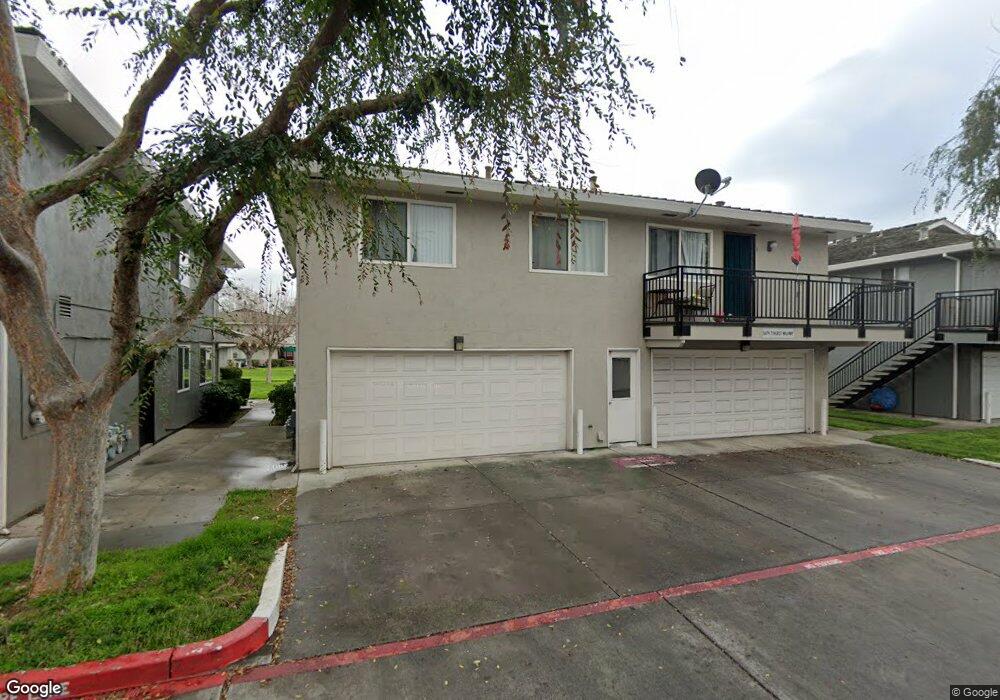
5479 Tyhurst Walkway Unit 4 San Jose, CA 95123
Oak Grove NeighborhoodEstimated Value: $458,454 - $535,000
2
Beds
1
Bath
798
Sq Ft
$615/Sq Ft
Est. Value
About This Home
This home is located at 5479 Tyhurst Walkway Unit 4, San Jose, CA 95123 and is currently estimated at $490,614, approximately $614 per square foot. 5479 Tyhurst Walkway Unit 4 is a home located in Santa Clara County with nearby schools including Hayes Elementary School, Davis (Caroline) Intermediate School, and Oak Grove High School.
Ownership History
Date
Name
Owned For
Owner Type
Purchase Details
Closed on
Jun 5, 2013
Sold by
Luo Huitao and Liu Huizhuo
Bought by
Luo Huitao and Liu Huizhuo
Current Estimated Value
Purchase Details
Closed on
Jun 29, 2010
Sold by
The Bank Of New York Mellon Trust Co
Bought by
Luo Huitao and Liu Huizhou
Purchase Details
Closed on
Apr 14, 2010
Sold by
Garcia Elvia
Bought by
The Bank Of New York Mellon Trust Compan
Purchase Details
Closed on
Jan 27, 2000
Sold by
Art Garibay
Bought by
Garcia Elvia
Home Financials for this Owner
Home Financials are based on the most recent Mortgage that was taken out on this home.
Original Mortgage
$169,750
Interest Rate
7.87%
Create a Home Valuation Report for This Property
The Home Valuation Report is an in-depth analysis detailing your home's value as well as a comparison with similar homes in the area
Home Values in the Area
Average Home Value in this Area
Purchase History
| Date | Buyer | Sale Price | Title Company |
|---|---|---|---|
| Luo Huitao | -- | None Available | |
| Luo Huitao | $145,000 | Fidelity Natl Title Co Of Ca | |
| The Bank Of New York Mellon Trust Compan | $185,000 | Accommodation | |
| Garcia Elvia | $175,000 | North American Title Co | |
| Garibay Art | -- | North American Title Co |
Source: Public Records
Mortgage History
| Date | Status | Borrower | Loan Amount |
|---|---|---|---|
| Previous Owner | Garcia Elvia | $169,750 |
Source: Public Records
Tax History Compared to Growth
Tax History
| Year | Tax Paid | Tax Assessment Tax Assessment Total Assessment is a certain percentage of the fair market value that is determined by local assessors to be the total taxable value of land and additions on the property. | Land | Improvement |
|---|---|---|---|---|
| 2025 | $2,913 | $185,758 | $92,879 | $92,879 |
| 2024 | $2,913 | $182,116 | $91,058 | $91,058 |
| 2023 | $2,856 | $178,546 | $89,273 | $89,273 |
| 2022 | $2,856 | $175,046 | $87,523 | $87,523 |
| 2021 | $2,807 | $171,614 | $85,807 | $85,807 |
| 2020 | $2,768 | $169,856 | $84,928 | $84,928 |
| 2019 | $2,713 | $166,526 | $83,263 | $83,263 |
| 2018 | $2,694 | $163,262 | $81,631 | $81,631 |
| 2017 | $2,658 | $160,062 | $80,031 | $80,031 |
| 2016 | $2,524 | $156,924 | $78,462 | $78,462 |
| 2015 | $2,462 | $154,568 | $77,284 | $77,284 |
| 2014 | $2,316 | $151,542 | $75,771 | $75,771 |
Source: Public Records
Map
Nearby Homes
- 5480 Tradewinds Walkway Unit 1
- 5512 Spinnaker Dr Unit 4
- 5503 Eagles Ln Unit 2
- 5558 Judith St Unit 1
- 341 Blossom Hill Rd Unit 3
- 5393 Palm Grove Ct
- 291 Tradewinds Dr Unit 7
- 312 Tradewinds Dr Unit 3
- 309 Tradewinds Dr Unit 3
- 310 Tradewinds Dr Unit 8
- 305 Tradewinds Dr Unit 5
- 303 Tradewinds Dr Unit 10
- 297 Tradewinds Dr Unit 105
- 5214 Jacana Ln
- 294 Macaw Place
- 233 Omira Dr
- 0 Deer Valley Rd Unit 225017975
- 184 Sun Blossom Dr
- 206 Blossom Hill Rd
- 510 Saddlebrook Dr Unit 27
- 5479 Tyhurst Walkway Unit 3
- 5479 Tyhurst Walkway Unit 1
- 5479 Tyhurst Walkway Unit 2
- 5479 Tyhurst Ww Unit 1
- 5479 Tyhurst Ww Unit 3
- 5479 Tyhurst Ww Unit 4
- 5479 Tyhurst Ww Unit 2
- 5485 Tyhurst Ww Unit 3
- 5485 Tyhurst Ww Unit 1
- 5485 Tyhurst Walkway Unit 4
- 5485 Tyhurst Walkway Unit 1
- 5485 Tyhurst Walkway
- 5485 Tyhurst Walkway Unit 2
- 5485 Tyhurst Walkway Unit 3
- 5473 Tyhurst Ww Unit 3
- 5473 Tyhurst Ww Unit 4
- 5473 Tyhurst Ww Unit 2
- 5473 Tyhurst Walkway Unit 2
- 5473 Tyhurst Walkway Unit 4
- 5473 Tyhurst Walkway Unit 3