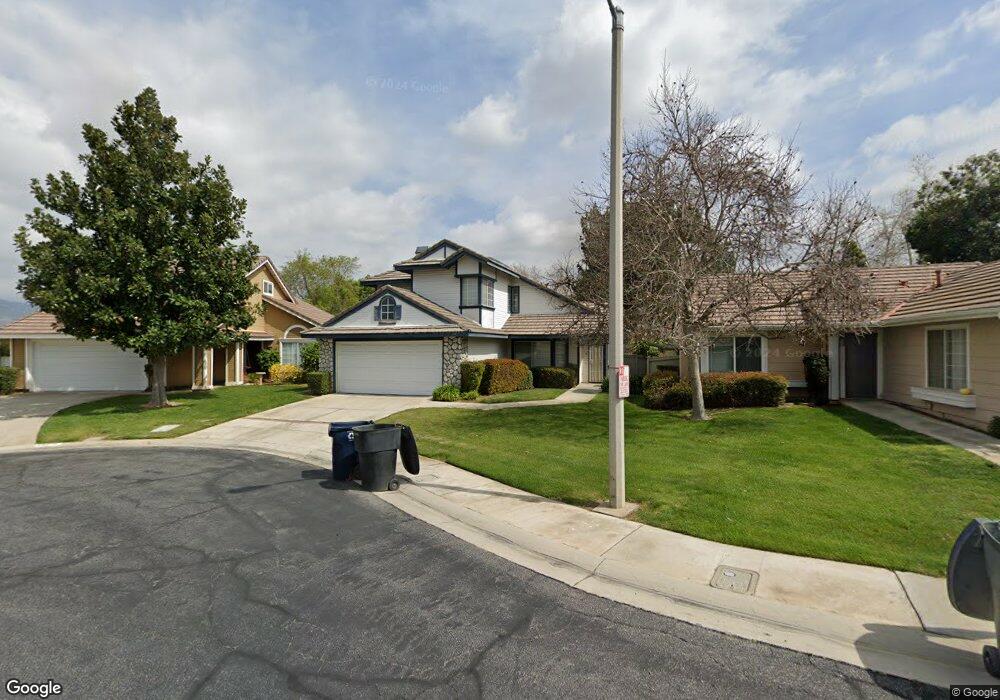
548 Carnes Cir Redlands, CA 92374
North Redlands NeighborhoodEstimated Value: $541,000 - $625,000
3
Beds
3
Baths
1,593
Sq Ft
$360/Sq Ft
Est. Value
About This Home
This home is located at 548 Carnes Cir, Redlands, CA 92374 and is currently estimated at $573,912, approximately $360 per square foot. 548 Carnes Cir is a home located in San Bernardino County with nearby schools including Crafton Elementary School, Moore Middle School, and Redlands East Valley High School.
Ownership History
Date
Name
Owned For
Owner Type
Purchase Details
Closed on
Jan 30, 2018
Sold by
Park Soon
Bought by
Park Soon and Lee Shukyeon
Current Estimated Value
Purchase Details
Closed on
Dec 23, 2011
Sold by
Lee Shuk Yeon
Bought by
Park Soon
Home Financials for this Owner
Home Financials are based on the most recent Mortgage that was taken out on this home.
Original Mortgage
$177,320
Outstanding Balance
$115,999
Interest Rate
3.12%
Mortgage Type
FHA
Estimated Equity
$457,913
Purchase Details
Closed on
Dec 19, 2011
Sold by
Dela Pena Nereida
Bought by
Park Soon
Home Financials for this Owner
Home Financials are based on the most recent Mortgage that was taken out on this home.
Original Mortgage
$177,320
Outstanding Balance
$115,999
Interest Rate
3.12%
Mortgage Type
FHA
Estimated Equity
$457,913
Purchase Details
Closed on
Jul 26, 2011
Sold by
Medina Hugo and Lopez Veronica
Bought by
Dela Pena Nereida
Purchase Details
Closed on
Apr 21, 2011
Sold by
Medina Hugo and Lopez Veronica A
Bought by
Dela Pena Nereida G
Purchase Details
Closed on
May 12, 2008
Sold by
Medina Hugo and Lopez Veronica A
Bought by
Medina Hugo and Lopez Veronica A
Purchase Details
Closed on
Jul 3, 2006
Sold by
Dela Pena Nereida G and De La Pena Nereira G
Bought by
Medina Hugo and Lopez Veronica A
Purchase Details
Closed on
Feb 14, 2002
Sold by
Wong Donald T Y
Bought by
Wong Vivien Chan
Purchase Details
Closed on
Jan 4, 2002
Sold by
Livin Chan Diana Chih Pao
Bought by
Wong Vivien Chan
Purchase Details
Closed on
Mar 5, 2001
Sold by
Livin Chan Diana Chih Pao
Bought by
Wong Vivien Chan
Purchase Details
Closed on
Feb 4, 2000
Sold by
Wong Donald T Y
Bought by
Wong Vivien Chan
Purchase Details
Closed on
Jan 29, 2000
Sold by
Chan Diana Chih Pao Tr
Bought by
Wong Vivien Chan
Purchase Details
Closed on
Nov 9, 1999
Sold by
Chan Diana Chih Pao Tr
Bought by
Wong Vivien Chan
Purchase Details
Closed on
Mar 8, 1997
Sold by
Wong Donald T Y
Bought by
Wong Vivien Chan
Purchase Details
Closed on
Feb 20, 1997
Sold by
Livin Chan Diana Chih Pao
Bought by
Chan Diana Chih Pao and Chan Diana C P
Purchase Details
Closed on
Feb 27, 1996
Sold by
Wong Donald T Y
Bought by
Wong Vivien Chan
Purchase Details
Closed on
Feb 22, 1996
Sold by
Chan Diana Chih Pao
Bought by
Wong Vivien Chan
Purchase Details
Closed on
Feb 3, 1995
Sold by
Wong Donald T Y
Bought by
Wong Vivien Chan
Purchase Details
Closed on
Jan 12, 1995
Sold by
Chan Diana Chih Pao
Bought by
Wong Vivien Chan
Purchase Details
Closed on
Dec 16, 1994
Sold by
Chan Diana Chih Pao
Bought by
Wong Vivien Chan
Create a Home Valuation Report for This Property
The Home Valuation Report is an in-depth analysis detailing your home's value as well as a comparison with similar homes in the area
Home Values in the Area
Average Home Value in this Area
Purchase History
| Date | Buyer | Sale Price | Title Company |
|---|---|---|---|
| Park Soon | -- | None Available | |
| Park Soon | -- | None Available | |
| Park Soon | $185,000 | None Available | |
| Dela Pena Nereida | -- | None Available | |
| Dela Pena Nereida G | -- | None Available | |
| Medina Hugo | -- | None Available | |
| Medina Hugo | -- | None Available | |
| Wong Vivien Chan | -- | -- | |
| Wong Vivien Chan | -- | -- | |
| Wong Vivien Chan | -- | -- | |
| Wong Vivien Chan | -- | -- | |
| Wong Vivien Chan | -- | -- | |
| Wong Vivien Chan | -- | -- | |
| Wong Vivien Chan | -- | -- | |
| Chan Diana Chih Pao | -- | -- | |
| Wong Vivien Chan | -- | -- | |
| Wong Vivien Chan | -- | -- | |
| Wong Vivien Chan | -- | -- | |
| Chan Diana Chih Pao | -- | -- | |
| Wong Vivien Chan | -- | -- | |
| Wong Vivien Chan | -- | -- | |
| Wong Vivien Chan | -- | -- | |
| Chan Diana Chih Pao | -- | -- |
Source: Public Records
Mortgage History
| Date | Status | Borrower | Loan Amount |
|---|---|---|---|
| Open | Park Soon | $177,320 |
Source: Public Records
Tax History
| Year | Tax Paid | Tax Assessment Tax Assessment Total Assessment is a certain percentage of the fair market value that is determined by local assessors to be the total taxable value of land and additions on the property. | Land | Improvement |
|---|---|---|---|---|
| 2025 | $2,827 | $232,368 | $56,521 | $175,847 |
| 2024 | $2,639 | $227,812 | $55,413 | $172,399 |
| 2023 | $2,635 | $223,345 | $54,326 | $169,019 |
| 2022 | $2,595 | $218,966 | $53,261 | $165,705 |
| 2021 | $2,641 | $214,673 | $52,217 | $162,456 |
| 2020 | $2,601 | $212,472 | $51,682 | $160,790 |
| 2019 | $2,527 | $208,306 | $50,669 | $157,637 |
| 2018 | $2,463 | $204,221 | $49,675 | $154,546 |
| 2017 | $2,441 | $200,217 | $48,701 | $151,516 |
| 2016 | $2,412 | $196,291 | $47,746 | $148,545 |
| 2015 | $2,393 | $193,343 | $47,029 | $146,314 |
| 2014 | $2,348 | $189,556 | $46,108 | $143,448 |
Source: Public Records
Map
Nearby Homes
- 626 N Dearborn St Unit 150
- 626 N Dearborn St Unit 7
- 626 N Dearborn St
- 0 E Colton Ave
- 1721 E Colton Ave Unit 33
- 1721 E Colton Ave Unit 106
- 1617 Waterford Ave
- 0 Wabash Ave Unit IV26041427
- 100 Amber Ct
- 1580 Lisa Ln
- 1160 Via Ravenna
- 1592 Christopher Ln
- 1575 Christopher Ln
- 1528 Laramie Ave
- 1226 Via Palermo
- 1665 Wabash Ave
- 616 N Lincoln St
- 56 Dearborn Cir
- 212 Eastpark Ln
- 450 Judson St Unit 94
- 544 Carnes Cir
- 552 Carnes Cir
- 540 Carnes Cir
- 547 Carnes Cir
- 551 Carnes Cir
- 543 Carnes Cir
- 1744 Kingston Cir
- 1727 Kingston Cir
- 1740 Kingston Cir
- 1723 Kingston Cir
- 1717 Independence Ave
- 1736 Kingston Cir
- 1732 Kingston Cir
- 1713 Independence Ave
- 1728 Kingston Cir
- 1741 Cambridge Cir
- 1737 Cambridge Cir
- 1724 Kingston Cir
- 1720 Kingston Cir
- 1709 Independence Ave
Your Personal Tour Guide
Ask me questions while you tour the home.