Estimated Value: $308,709 - $342,000
4
Beds
2
Baths
2,160
Sq Ft
$154/Sq Ft
Est. Value
About This Home
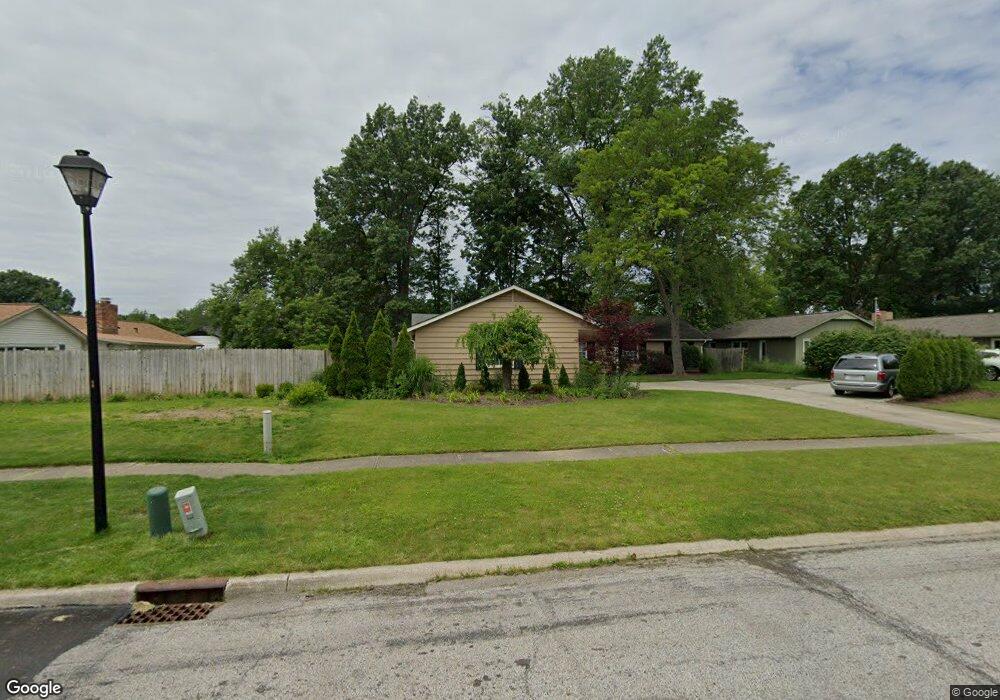
This home is located at 548 Crossbrook Dr, Berea, OH 44017 and is currently estimated at $331,927, approximately $153 per square foot. 548 Crossbrook Dr is a home located in Cuyahoga County with nearby schools including Grindstone Elementary School, Berea-Midpark Middle School, and Berea-Midpark High School.
Ownership History
Date
Name
Owned For
Owner Type
Purchase Details
Closed on
Jan 24, 2006
Sold by
Volpe Audrey L
Bought by
Volpe Arthur M
Current Estimated Value
Home Financials for this Owner
Home Financials are based on the most recent Mortgage that was taken out on this home.
Original Mortgage
$179,000
Interest Rate
5.75%
Mortgage Type
Purchase Money Mortgage
Purchase Details
Closed on
Sep 28, 1998
Sold by
Justice Janice K
Bought by
Volpe Audrey L
Purchase Details
Closed on
Jul 6, 1993
Sold by
Justice Keith O
Bought by
Justice Janice K
Purchase Details
Closed on
Mar 20, 1989
Sold by
Overton Marie M
Bought by
Justice Keith O
Purchase Details
Closed on
Jun 12, 1981
Sold by
Richard S Overton
Bought by
Overton Marie M
Purchase Details
Closed on
Jul 16, 1979
Sold by
Overton Richard S and Overton Marie M
Bought by
Richard S Overton
Purchase Details
Closed on
Jan 1, 1975
Bought by
Overton Richard S and Overton Marie M
Create a Home Valuation Report for This Property
The Home Valuation Report is an in-depth analysis detailing your home's value as well as a comparison with similar homes in the area
Home Values in the Area
Average Home Value in this Area
Purchase History
| Date | Buyer | Sale Price | Title Company |
|---|---|---|---|
| Volpe Arthur M | -- | Public | |
| Volpe Audrey L | $145,000 | Executive Title Agency Corp | |
| Justice Janice K | -- | -- | |
| Justice Keith O | $97,500 | -- | |
| Overton Marie M | -- | -- | |
| Richard S Overton | -- | -- | |
| Overton Richard S | -- | -- |
Source: Public Records
Mortgage History
| Date | Status | Borrower | Loan Amount |
|---|---|---|---|
| Previous Owner | Volpe Arthur M | $179,000 |
Source: Public Records
Tax History
| Year | Tax Paid | Tax Assessment Tax Assessment Total Assessment is a certain percentage of the fair market value that is determined by local assessors to be the total taxable value of land and additions on the property. | Land | Improvement |
|---|---|---|---|---|
| 2025 | $4,942 | $95,200 | $17,325 | $77,875 |
| 2024 | $4,946 | $95,200 | $17,325 | $77,875 |
| 2023 | $4,075 | $67,970 | $14,770 | $53,200 |
| 2022 | $4,077 | $67,970 | $14,770 | $53,200 |
| 2021 | $4,625 | $67,970 | $14,770 | $53,200 |
| 2020 | $4,419 | $57,610 | $12,530 | $45,080 |
| 2019 | $4,301 | $164,600 | $35,800 | $128,800 |
| 2018 | $3,947 | $57,610 | $12,530 | $45,080 |
| 2017 | $3,885 | $48,550 | $11,340 | $37,210 |
| 2016 | $3,856 | $48,550 | $11,340 | $37,210 |
| 2015 | $3,836 | $48,550 | $11,340 | $37,210 |
| 2014 | $3,836 | $51,110 | $11,940 | $39,170 |
Source: Public Records
Map
Nearby Homes
- 23265 Wainwright Terrace
- 23155 Wainwright Terrace
- 23002 Chandlers Ln
- 23002 Chandlers Ln Unit 221
- 23004 Chandlers Ln Unit 4-344
- 487 Bridle Ln
- 9441 Lindbergh Blvd
- 347 Beeler Dr
- 0 Sprague Rd Unit 5192975
- 9925 Aldridge Dr
- 380 Adrian Dr
- 10151 Aldridge Dr
- 8810 Leatherleaf Dr
- 8809 Leatherleaf Dr
- 10209 Bryant Dr
- 24690 Thicket Ln Unit M32
- 8896 Firethorne Dr
- 8924 Leatherleaf Dr
- 24895 W Northwood Dr
- 516 Fair St
- 540 Crossbrook Dr
- 550 Crossbrook Dr
- 619 Merrimak Dr
- 607 Perham Dr
- 605 Perham Dr
- 609 Merrimak Dr
- 603 Perham Dr
- 551 Crossbrook Dr
- 543 Crossbrook Dr
- 557 Crossbrook Dr
- 535 Crossbrook Dr
- 620 Merrimak Dr
- 610 Merrimak Dr
- 601 Perham Dr
- 640 Merrimak Dr
- 655 Tauton Dr
- 591 Perham Dr
- 593 Perham Dr
- 589 Perham Dr
- 649 Merrimak Dr
Your Personal Tour Guide
Ask me questions while you tour the home.