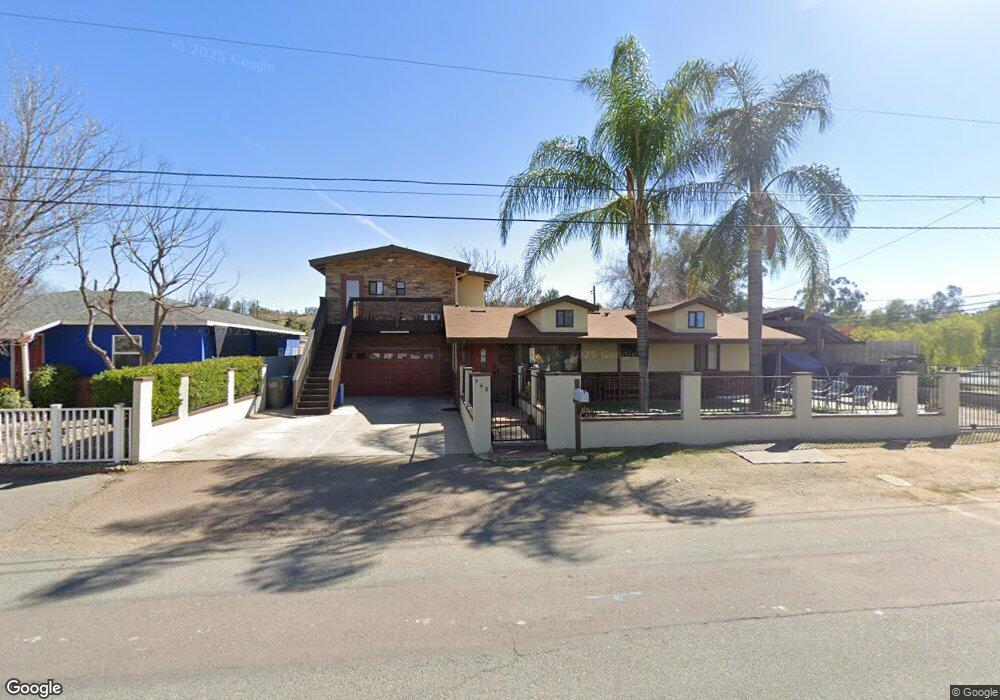
548 E St Ramona, CA 92065
Estimated Value: $705,000 - $755,376
4
Beds
3
Baths
1,822
Sq Ft
$402/Sq Ft
Est. Value
About This Home
This home is located at 548 E St, Ramona, CA 92065 and is currently estimated at $732,344, approximately $401 per square foot. 548 E St is a home located in San Diego County with nearby schools including Ramona Elementary School, Olive Peirce Middle School, and Ramona High School.
Ownership History
Date
Name
Owned For
Owner Type
Purchase Details
Closed on
May 19, 2006
Sold by
Laforge Stephen and Byrne Andrea G
Bought by
Lutt Samuel and Ruiz Karina
Current Estimated Value
Home Financials for this Owner
Home Financials are based on the most recent Mortgage that was taken out on this home.
Original Mortgage
$95,000
Outstanding Balance
$56,337
Interest Rate
6.63%
Mortgage Type
Stand Alone Second
Estimated Equity
$676,007
Purchase Details
Closed on
Apr 7, 1999
Sold by
Va
Bought by
Laforge Stephen and Byrne Andrea G
Home Financials for this Owner
Home Financials are based on the most recent Mortgage that was taken out on this home.
Original Mortgage
$148,000
Interest Rate
7.04%
Mortgage Type
Seller Take Back
Purchase Details
Closed on
Sep 10, 1998
Sold by
Countrywide Home Loans Inc
Bought by
Va
Purchase Details
Closed on
May 28, 1997
Sold by
Will William C
Bought by
Will William C and Hallmann Jennifer L
Purchase Details
Closed on
Jul 26, 1993
Create a Home Valuation Report for This Property
The Home Valuation Report is an in-depth analysis detailing your home's value as well as a comparison with similar homes in the area
Home Values in the Area
Average Home Value in this Area
Purchase History
| Date | Buyer | Sale Price | Title Company |
|---|---|---|---|
| Lutt Samuel | $475,000 | Commonwealth Land Title Co | |
| Laforge Stephen | $149,000 | Old Republic Title Company | |
| Va | -- | Landsafe Title | |
| Countrywide Home Loans Inc | $131,626 | Landsafe Title | |
| Will William C | -- | -- | |
| -- | $139,900 | -- |
Source: Public Records
Mortgage History
| Date | Status | Borrower | Loan Amount |
|---|---|---|---|
| Open | Lutt Samuel | $95,000 | |
| Open | Lutt Samuel | $380,000 | |
| Previous Owner | Laforge Stephen | $148,000 |
Source: Public Records
Tax History
| Year | Tax Paid | Tax Assessment Tax Assessment Total Assessment is a certain percentage of the fair market value that is determined by local assessors to be the total taxable value of land and additions on the property. | Land | Improvement |
|---|---|---|---|---|
| 2025 | $8,405 | $700,509 | $396,301 | $304,208 |
| 2024 | $8,405 | $650,000 | $356,000 | $294,000 |
| 2023 | $7,320 | $620,000 | $340,000 | $280,000 |
| 2022 | $7,622 | $610,000 | $335,000 | $275,000 |
| 2021 | $6,702 | $522,000 | $287,000 | $235,000 |
| 2020 | $6,703 | $522,000 | $287,000 | $235,000 |
| 2019 | $6,162 | $475,000 | $287,000 | $188,000 |
| 2018 | $6,104 | $475,000 | $287,000 | $188,000 |
| 2017 | $6,050 | $470,000 | $284,000 | $186,000 |
| 2016 | $5,597 | $430,000 | $260,000 | $170,000 |
| 2015 | $4,816 | $360,000 | $218,000 | $142,000 |
| 2014 | $4,136 | $300,000 | $182,000 | $118,000 |
Source: Public Records
Map
Nearby Homes
Your Personal Tour Guide
Ask me questions while you tour the home.