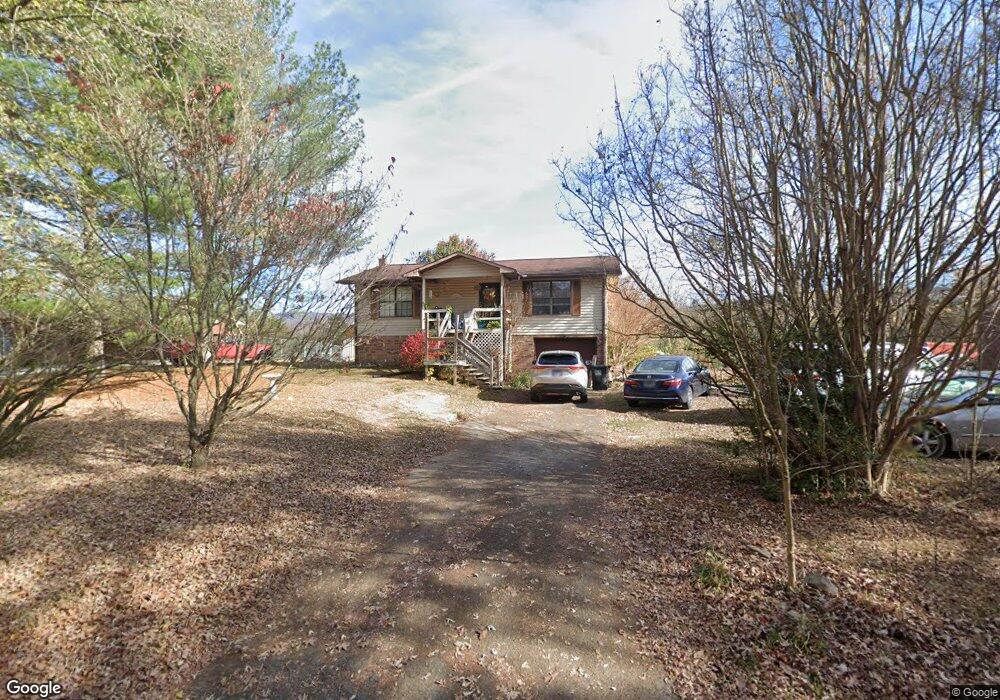
548 Mcdowell Rd Dunlap, TN 37327
Estimated Value: $187,000 - $214,000
2
Beds
1
Bath
960
Sq Ft
$204/Sq Ft
Est. Value
About This Home
This home is located at 548 Mcdowell Rd, Dunlap, TN 37327 and is currently estimated at $195,448, approximately $203 per square foot. 548 Mcdowell Rd is a home located in Sequatchie County with nearby schools including Griffith Elementary School, Sequatchie County Middle School, and Sequatchie County High School.
Ownership History
Date
Name
Owned For
Owner Type
Purchase Details
Closed on
Dec 2, 2004
Sold by
Nichols Christina L
Bought by
Andrew Stilts Carl
Current Estimated Value
Purchase Details
Closed on
Mar 31, 2004
Bought by
Nichols Christina L
Purchase Details
Closed on
Feb 12, 2003
Sold by
John Miketinac and John Camille
Bought by
Nichols Michael A and Nichols Christ
Home Financials for this Owner
Home Financials are based on the most recent Mortgage that was taken out on this home.
Original Mortgage
$55,100
Interest Rate
5.95%
Purchase Details
Closed on
Aug 8, 2002
Sold by
Hud
Bought by
John Miketinac and John Camille
Purchase Details
Closed on
Dec 27, 2001
Sold by
Citimortgage
Bought by
Hud
Purchase Details
Closed on
Dec 14, 2001
Bought by
Sec Pf Hud % Golden Feather Realty
Purchase Details
Closed on
Oct 1, 2001
Bought by
Citimortgage Inc
Purchase Details
Closed on
May 3, 2000
Sold by
Hobbs David L and Hobbs Linda Wife
Bought by
Hughes Adam H and Hughes Amanda E
Create a Home Valuation Report for This Property
The Home Valuation Report is an in-depth analysis detailing your home's value as well as a comparison with similar homes in the area
Home Values in the Area
Average Home Value in this Area
Purchase History
| Date | Buyer | Sale Price | Title Company |
|---|---|---|---|
| Andrew Stilts Carl | $76,000 | -- | |
| Andrew Stilts Carl | $76,000 | -- | |
| Nichols Christina L | -- | -- | |
| Nichols Christina L | -- | -- | |
| Nichols Michael A | $68,900 | -- | |
| Nichols Michael A | $68,900 | -- | |
| John Miketinac | $37,500 | -- | |
| John Miketinac | $37,500 | -- | |
| Hud | $71,847 | -- | |
| Hud | $71,847 | -- | |
| Sec Pf Hud % Golden Feather Realty | $71,800 | -- | |
| Sec Pf Hud % Golden Feather Realty | $71,800 | -- | |
| Citimortgage Inc | $71,800 | -- | |
| Citimortgage Inc | $71,800 | -- | |
| Hughes Adam H | $63,500 | -- | |
| Hughes Adam H | $63,500 | -- |
Source: Public Records
Mortgage History
| Date | Status | Borrower | Loan Amount |
|---|---|---|---|
| Previous Owner | Hughes Adam H | $55,100 |
Source: Public Records
Tax History
| Year | Tax Paid | Tax Assessment Tax Assessment Total Assessment is a certain percentage of the fair market value that is determined by local assessors to be the total taxable value of land and additions on the property. | Land | Improvement |
|---|---|---|---|---|
| 2025 | $860 | $35,600 | $2,325 | $33,275 |
| 2024 | $860 | $35,600 | $2,325 | $33,275 |
| 2023 | $860 | $35,600 | $2,325 | $33,275 |
| 2022 | $696 | $20,975 | $1,750 | $19,225 |
| 2021 | $685 | $20,975 | $1,750 | $19,225 |
| 2020 | $685 | $20,975 | $1,750 | $19,225 |
| 2019 | $664 | $20,325 | $1,750 | $18,575 |
| 2018 | $656 | $20,325 | $1,750 | $18,575 |
| 2017 | $649 | $20,325 | $1,750 | $18,575 |
| 2016 | $713 | $21,425 | $2,075 | $19,350 |
| 2015 | $714 | $21,425 | $2,075 | $19,350 |
| 2014 | $714 | $21,425 | $2,075 | $19,350 |
Source: Public Records
Map
Nearby Homes
- Lot 36 River Ridge Dr
- 95 A Main St
- 2 Fredonia Rd
- 1 Fredonia Rd
- 3 Fredonia Rd
- 0 State Rt 399 Lot 13
- Lot 13 B Greenfields Way
- 0 SE US Hwy 127 Unit 1519993
- 0 SE US Hwy 127 Unit 1519990
- 0 SE US Hwy 127 Unit 1519988
- 0 SE US Hwy 127 Unit 1314389
- 0 SE US Hwy 127 Unit 1519979
- 0 SE US Hwy 127 Unit 1519991
- 0 SE US Hwy 127 Unit 1519984
- 21550 U S 127
- 21552 U S 127
- 453 Hill Cir
- 254 Cdl Trail
- 410 Cherry St
- 95 Blue Sky Rd Rd
- 548 Mcdowell Rd
- 548 Mcdowell Rd
- 528 Mcdowell Rd
- 566 Mcdowell Rd
- 566 Mcdowell Rd
- 528 Mcdowell Rd
- 588 Mcdowell Rd
- 510 Mcdowell Rd
- 588 Mcdowell Rd
- 588 Mcdowell Rd
- 557 Mcdowell Rd
- 531 Mcdowell Rd
- 575 Mcdowell Rd
- 509 Mcdowell Rd
- 498 Mcdowell Rd
- 591 Mcdowell Rd
- 612 Mcdowell Rd
- 481 Mc Dowell Rd
- 481 Mcdowell Rd
- 472 Mcdowell Rd
Your Personal Tour Guide
Ask me questions while you tour the home.