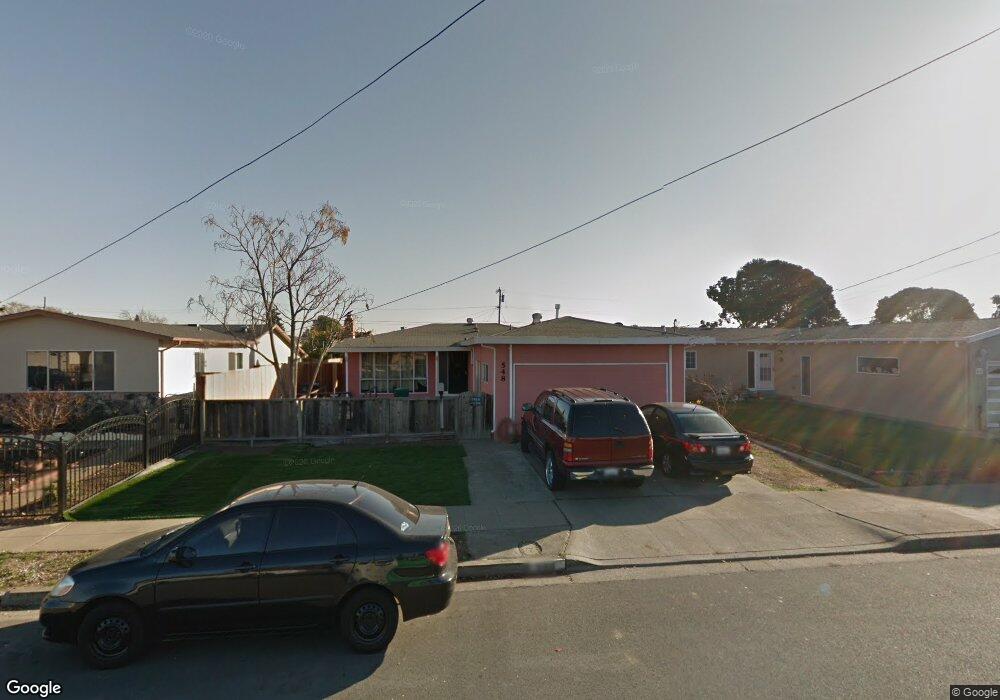
548 Minerva St Hayward, CA 94544
Tennyson-Alquire NeighborhoodEstimated Value: $918,961 - $937,000
3
Beds
3
Baths
1,320
Sq Ft
$703/Sq Ft
Est. Value
About This Home
This home is located at 548 Minerva St, Hayward, CA 94544 and is currently estimated at $928,490, approximately $703 per square foot. 548 Minerva St is a home located in Alameda County with nearby schools including Ruus Elementary School, Cesar Chavez Middle School, and Tennyson High School.
Ownership History
Date
Name
Owned For
Owner Type
Purchase Details
Closed on
Oct 8, 2020
Sold by
Talwar Vashti
Bought by
Yadav Sahil
Current Estimated Value
Home Financials for this Owner
Home Financials are based on the most recent Mortgage that was taken out on this home.
Original Mortgage
$760,000
Outstanding Balance
$675,979
Interest Rate
2.9%
Mortgage Type
New Conventional
Estimated Equity
$252,511
Purchase Details
Closed on
Sep 14, 2020
Sold by
Tummala Sarat Chandra and Kommineni Uma Sindu
Bought by
Yadav Sahil
Home Financials for this Owner
Home Financials are based on the most recent Mortgage that was taken out on this home.
Original Mortgage
$760,000
Outstanding Balance
$675,979
Interest Rate
2.9%
Mortgage Type
New Conventional
Estimated Equity
$252,511
Purchase Details
Closed on
Apr 11, 2018
Sold by
Macias Salvador
Bought by
Tummala Sarat Chandra and Kommineni Uma Sindu
Home Financials for this Owner
Home Financials are based on the most recent Mortgage that was taken out on this home.
Original Mortgage
$594,000
Interest Rate
3.81%
Mortgage Type
Adjustable Rate Mortgage/ARM
Purchase Details
Closed on
Dec 31, 2007
Sold by
Villegas Miriam Eunice Plascencia
Bought by
Macias Salvador
Home Financials for this Owner
Home Financials are based on the most recent Mortgage that was taken out on this home.
Original Mortgage
$360,000
Interest Rate
6.07%
Mortgage Type
Purchase Money Mortgage
Purchase Details
Closed on
Dec 16, 2007
Sold by
Deutsche Bank National Trust Co
Bought by
Macias Salvador
Home Financials for this Owner
Home Financials are based on the most recent Mortgage that was taken out on this home.
Original Mortgage
$360,000
Interest Rate
6.07%
Mortgage Type
Purchase Money Mortgage
Purchase Details
Closed on
Sep 14, 2007
Sold by
Trede Tammy C and Trede Dennis J
Bought by
Deutsche Bank National Trust Co and Fremont Home Loan Trust 2006-3
Purchase Details
Closed on
Aug 10, 2005
Sold by
Trede Dennis J and Trede Tammy C
Bought by
Trede Dennis J and Trede Tammy C
Home Financials for this Owner
Home Financials are based on the most recent Mortgage that was taken out on this home.
Original Mortgage
$456,000
Interest Rate
6.9%
Mortgage Type
New Conventional
Purchase Details
Closed on
Apr 16, 2002
Sold by
Trede Dennis J and Trede Dennis
Bought by
Trede Dennis J and Trede Tammy C
Home Financials for this Owner
Home Financials are based on the most recent Mortgage that was taken out on this home.
Original Mortgage
$208,000
Interest Rate
8.9%
Create a Home Valuation Report for This Property
The Home Valuation Report is an in-depth analysis detailing your home's value as well as a comparison with similar homes in the area
Home Values in the Area
Average Home Value in this Area
Purchase History
| Date | Buyer | Sale Price | Title Company |
|---|---|---|---|
| Yadav Sahil | -- | Chicago Title | |
| Yadav Sahil | $810,000 | Chicago Title Company | |
| Tummala Sarat Chandra | $660,000 | Old Republic Title Company | |
| Macias Salvador | -- | First American Title Company | |
| Macias Salvador | $400,000 | First American Title Company | |
| Deutsche Bank National Trust Co | $525,000 | None Available | |
| Trede Dennis J | -- | Old Republic Title Company | |
| Trede Dennis J | -- | Fidelity National Title Co |
Source: Public Records
Mortgage History
| Date | Status | Borrower | Loan Amount |
|---|---|---|---|
| Open | Yadav Sahil | $760,000 | |
| Previous Owner | Tummala Sarat Chandra | $594,000 | |
| Previous Owner | Macias Salvador | $360,000 | |
| Previous Owner | Trede Dennis J | $456,000 | |
| Previous Owner | Trede Dennis J | $208,000 |
Source: Public Records
Tax History Compared to Growth
Tax History
| Year | Tax Paid | Tax Assessment Tax Assessment Total Assessment is a certain percentage of the fair market value that is determined by local assessors to be the total taxable value of land and additions on the property. | Land | Improvement |
|---|---|---|---|---|
| 2025 | $10,474 | $869,759 | $259,780 | $616,979 |
| 2024 | $10,474 | $852,572 | $254,688 | $604,884 |
| 2023 | $10,316 | $842,724 | $249,696 | $593,028 |
| 2022 | $10,112 | $819,200 | $244,800 | $581,400 |
| 2021 | $10,029 | $803,000 | $240,000 | $570,000 |
| 2020 | $8,618 | $686,663 | $205,999 | $480,664 |
| 2019 | $8,690 | $673,200 | $201,960 | $471,240 |
| 2018 | $5,811 | $461,747 | $155,839 | $305,908 |
| 2017 | $5,678 | $452,695 | $152,784 | $299,911 |
| 2016 | $5,354 | $443,819 | $149,789 | $294,030 |
| 2015 | $5,248 | $437,155 | $147,540 | $289,615 |
| 2014 | $4,891 | $420,000 | $126,000 | $294,000 |
Source: Public Records
Map
Nearby Homes
- 552 Celia St
- 41 Astrida Dr Unit 9
- 878 Folsom Ave
- 32 Astrida Dr Unit 2
- 28222 Lustig Ct
- 29223 Whalebone Way
- 29223 Whalebone Way Unit 404
- 29235 Lone Tree Place
- 28315 Rochelle Ave
- 27894 Andrea St
- 29255 Harpoon Way
- 37 Lance Way
- 29138 Delgado Rd
- 1127 Hat Creek Way
- 29288 Chance St
- 29133 De la Cruz Rd
- 918 W Tennyson Rd Unit 105
- 27949 Thornton Ct Unit 1B
- 27906 Thackeray Ave
- 933 New England Village Dr