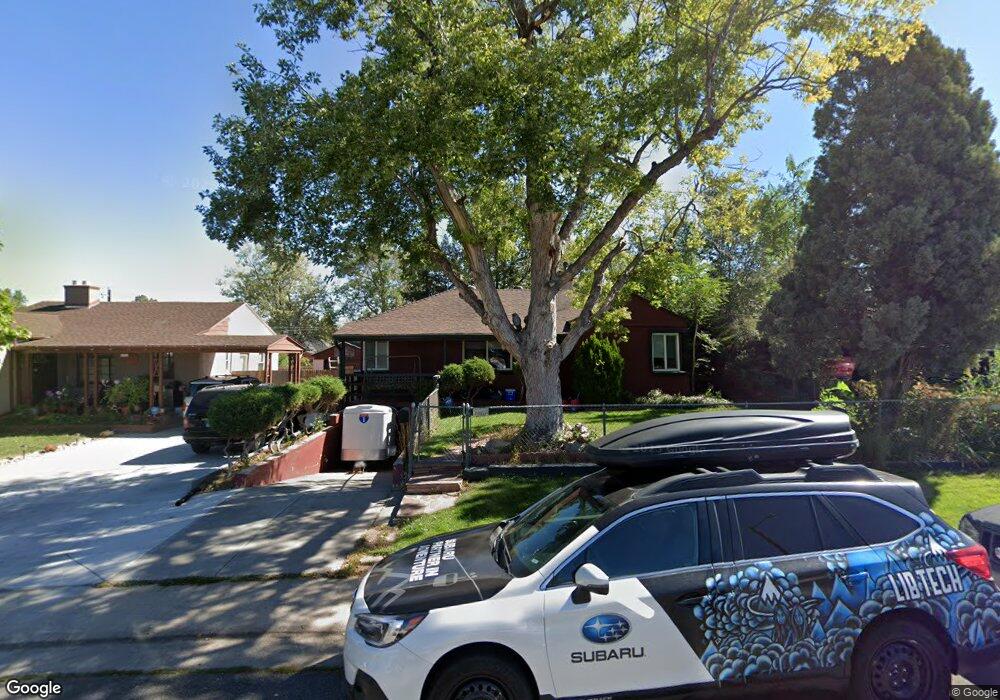
548 S Bryant St Denver, CO 80219
Athmar Park NeighborhoodEstimated Value: $522,000 - $615,000
4
Beds
2
Baths
1,636
Sq Ft
$344/Sq Ft
Est. Value
About This Home
This home is located at 548 S Bryant St, Denver, CO 80219 and is currently estimated at $563,355, approximately $344 per square foot. 548 S Bryant St is a home located in Denver County with nearby schools including Valverde Elementary School, Kepner Beacon Middle School, and West High School.
Ownership History
Date
Name
Owned For
Owner Type
Purchase Details
Closed on
Oct 21, 2013
Sold by
Carter Rachel L
Bought by
Olson Matthew and Olson Andrea
Current Estimated Value
Home Financials for this Owner
Home Financials are based on the most recent Mortgage that was taken out on this home.
Original Mortgage
$212,430
Outstanding Balance
$159,996
Interest Rate
4.56%
Mortgage Type
New Conventional
Estimated Equity
$403,359
Purchase Details
Closed on
Dec 13, 2000
Sold by
Carter Rachel L
Bought by
Carter Rachel L
Home Financials for this Owner
Home Financials are based on the most recent Mortgage that was taken out on this home.
Original Mortgage
$131,000
Interest Rate
7.72%
Purchase Details
Closed on
Mar 30, 1999
Sold by
Jaimes Vences Adan and Jaimes Maria N
Bought by
Carter Rachel L and Webber Laurie A
Home Financials for this Owner
Home Financials are based on the most recent Mortgage that was taken out on this home.
Original Mortgage
$118,800
Interest Rate
6.82%
Create a Home Valuation Report for This Property
The Home Valuation Report is an in-depth analysis detailing your home's value as well as a comparison with similar homes in the area
Home Values in the Area
Average Home Value in this Area
Purchase History
| Date | Buyer | Sale Price | Title Company |
|---|---|---|---|
| Olson Matthew | $219,000 | Land Title Guarantee Company | |
| Carter Rachel L | -- | North American Title | |
| Carter Rachel L | $122,500 | Land Title |
Source: Public Records
Mortgage History
| Date | Status | Borrower | Loan Amount |
|---|---|---|---|
| Open | Olson Matthew | $212,430 | |
| Previous Owner | Carter Rachel L | $131,000 | |
| Previous Owner | Carter Rachel L | $118,800 |
Source: Public Records
Tax History Compared to Growth
Tax History
| Year | Tax Paid | Tax Assessment Tax Assessment Total Assessment is a certain percentage of the fair market value that is determined by local assessors to be the total taxable value of land and additions on the property. | Land | Improvement |
|---|---|---|---|---|
| 2024 | $2,841 | $35,870 | $7,830 | $28,040 |
| 2023 | $2,779 | $35,870 | $7,830 | $28,040 |
| 2022 | $2,121 | $26,670 | $11,940 | $14,730 |
| 2021 | $2,047 | $27,430 | $12,280 | $15,150 |
| 2020 | $2,114 | $28,490 | $7,140 | $21,350 |
| 2019 | $2,055 | $28,490 | $7,140 | $21,350 |
| 2018 | $1,728 | $22,330 | $5,400 | $16,930 |
| 2017 | $1,722 | $22,330 | $5,400 | $16,930 |
| 2016 | $1,391 | $17,060 | $4,474 | $12,586 |
| 2015 | $1,333 | $17,060 | $4,474 | $12,586 |
| 2014 | $838 | $10,090 | $2,484 | $7,606 |
Source: Public Records
Map
Nearby Homes
- 527 S Bryant St
- 480 S Canosa Ct
- 360 S Bryant St
- 2251 W Custer Place
- 601 S Dale Ct
- 695 S Bryant St
- 326 S Alcott St
- 2120 W Custer Place
- 737 S Clay St
- 2141 W Gill Place
- 222 S Canosa Ct
- 740 S Eliot St
- 3073 W Center Ave Unit A
- 3073 W Center Ave Unit C
- 3092 W Alaska Place
- 1955 W Virginia Ave
- 875 S Dale Ct
- 1557 W Dakota Ave
- 1519 W Alaska Place
- 118 S Dale Ct
- 540 S Bryant St
- 562 S Bryant St
- 534 S Bryant St
- 570 S Bryant St
- 551 S Bryant St
- 530 S Bryant St
- 559 S Bryant St
- 555 S Alcott St
- 565 S Alcott St
- 531 S Alcott St
- 575 S Alcott St
- 584 S Bryant St
- 525 S Alcott St
- 512 S Bryant St
- 575 S Bryant St
- 519 S Alcott St
- 581 S Bryant St
- 525 S Bryant St
- 590 S Bryant St
- 585 S Alcott St