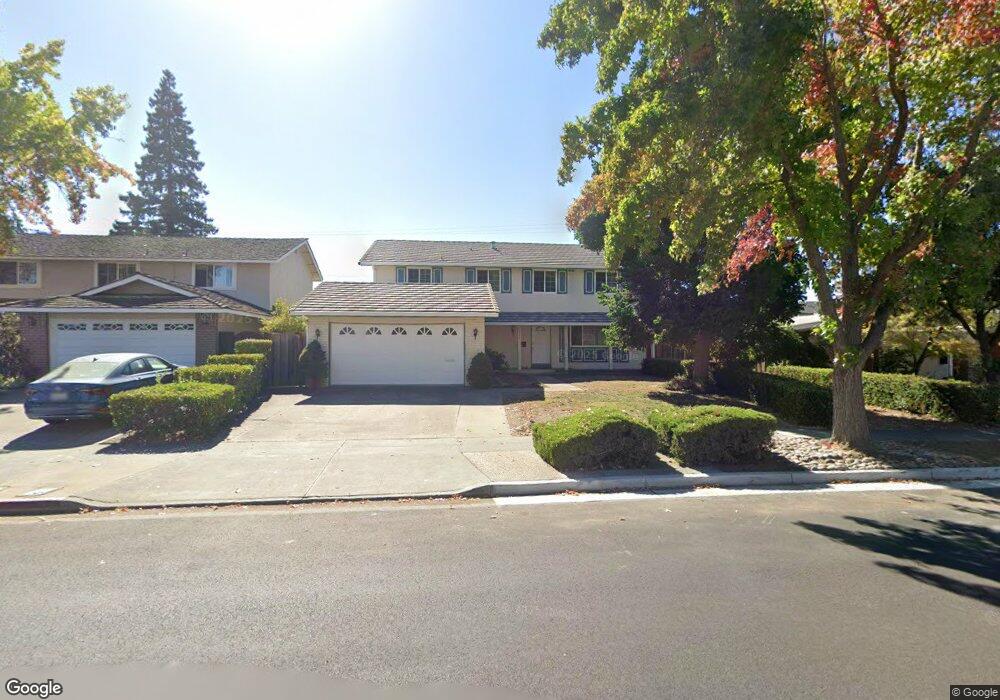
5486 Ora St San Jose, CA 95129
West San Jose NeighborhoodEstimated Value: $3,200,548 - $3,654,000
5
Beds
3
Baths
2,156
Sq Ft
$1,570/Sq Ft
Est. Value
About This Home
This home is located at 5486 Ora St, San Jose, CA 95129 and is currently estimated at $3,385,387, approximately $1,570 per square foot. 5486 Ora St is a home located in Santa Clara County with nearby schools including Nelson S. Dilworth Elementary School, Joaquin Miller Middle, and Lynbrook High School.
Ownership History
Date
Name
Owned For
Owner Type
Purchase Details
Closed on
Jul 17, 2020
Sold by
Hsu Jason C and Wang Nanqiao
Bought by
Hsu Jason Chengbin and Wang Nanqiao
Current Estimated Value
Home Financials for this Owner
Home Financials are based on the most recent Mortgage that was taken out on this home.
Original Mortgage
$510,000
Outstanding Balance
$361,134
Interest Rate
3.2%
Mortgage Type
New Conventional
Estimated Equity
$3,024,253
Purchase Details
Closed on
May 26, 2018
Sold by
Hsu Jason Chengbin and Hsu Jason C
Bought by
Hsu Jaon Chengbin and Wang Nanqiao
Purchase Details
Closed on
Mar 3, 2011
Sold by
Blazina Joseph J and Blazina Antonietta S
Bought by
Hsu Jason C and Wang Nanqiao
Home Financials for this Owner
Home Financials are based on the most recent Mortgage that was taken out on this home.
Original Mortgage
$690,000
Interest Rate
4%
Mortgage Type
New Conventional
Create a Home Valuation Report for This Property
The Home Valuation Report is an in-depth analysis detailing your home's value as well as a comparison with similar homes in the area
Home Values in the Area
Average Home Value in this Area
Purchase History
| Date | Buyer | Sale Price | Title Company |
|---|---|---|---|
| Hsu Jason Chengbin | -- | Chicago Title Company | |
| Hsu Jason C | -- | Chicago Title Company | |
| Hsu Jaon Chengbin | -- | None Available | |
| Hsu Jason C | $1,154,500 | Old Republic Title Company |
Source: Public Records
Mortgage History
| Date | Status | Borrower | Loan Amount |
|---|---|---|---|
| Open | Hsu Jason C | $510,000 | |
| Closed | Hsu Jason C | $690,000 |
Source: Public Records
Tax History Compared to Growth
Tax History
| Year | Tax Paid | Tax Assessment Tax Assessment Total Assessment is a certain percentage of the fair market value that is determined by local assessors to be the total taxable value of land and additions on the property. | Land | Improvement |
|---|---|---|---|---|
| 2025 | $18,532 | $1,479,029 | $1,183,162 | $295,867 |
| 2024 | $18,532 | $1,450,029 | $1,159,963 | $290,066 |
| 2023 | $18,344 | $1,421,598 | $1,137,219 | $284,379 |
| 2022 | $18,246 | $1,393,724 | $1,114,921 | $278,803 |
| 2021 | $18,015 | $1,366,397 | $1,093,060 | $273,337 |
| 2020 | $17,701 | $1,352,388 | $1,081,853 | $270,535 |
| 2019 | $17,344 | $1,325,872 | $1,060,641 | $265,231 |
| 2018 | $16,777 | $1,299,876 | $1,039,845 | $260,031 |
| 2017 | $16,707 | $1,274,389 | $1,019,456 | $254,933 |
| 2016 | $16,212 | $1,249,402 | $999,467 | $249,935 |
| 2015 | $16,118 | $1,230,636 | $984,455 | $246,181 |
| 2014 | $15,382 | $1,206,530 | $965,171 | $241,359 |
Source: Public Records
Map
Nearby Homes
- 1367 Cordelia Ave
- 5887 Amapola Dr
- 18980 Newsom Ave
- 5635 W Walbrook Dr
- 1055 Happy Valley Ave
- 18817 Tuggle Ave
- 6117 Brigantine Dr
- 915 S Tantau Ave
- 1063 Whitebick Dr
- 1577 Maurice Ln
- 4640 Venice Way
- 18630 Crabtree Ave
- 6179 Shadygrove Dr
- 5043 Le Miccine Terrace Unit 76
- 12140 Woodside Dr
- 10337 Menhart Ln
- 19220 Tilson Ave
- 1370 Saratoga Ave
- 1364 Saratoga Ave
- 1281 Saratoga Ave
- 5490 Ora St
- 5482 Ora St
- 1167 Wunderlich Dr
- 5494 Ora St
- 1122 Littleoak Cir
- 1118 Littleoak Cir
- 1171 Wunderlich Dr
- 1163 Wunderlich Dr
- 5501 Bigoak Dr
- 5478 Ora St
- 1116 Littleoak Cir
- 1175 Wunderlich Dr
- 1124 Littleoak Cir
- 1155 Wunderlich Dr
- 5505 Bigoak Dr
- 5526 Ora St
- 5479 Ora St
- 5474 Ora St
- 1114 Littleoak Cir
- 1179 Wunderlich Dr