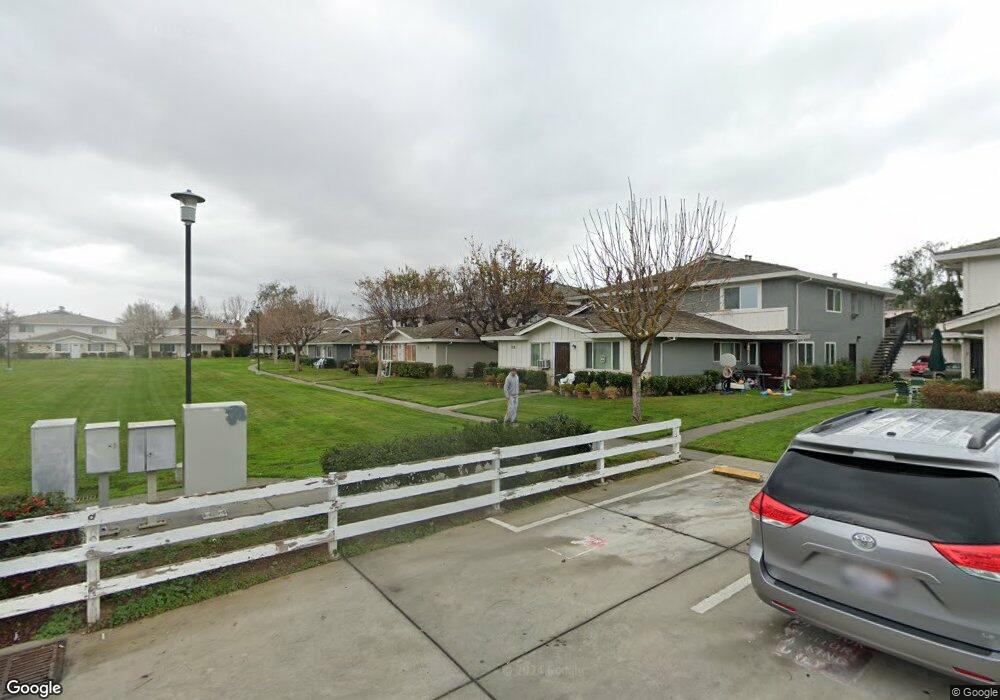
5486 Tradewinds Walkway Unit 4 San Jose, CA 95123
Oak Grove NeighborhoodEstimated Value: $477,959 - $662,000
2
Beds
1
Bath
798
Sq Ft
$673/Sq Ft
Est. Value
About This Home
This home is located at 5486 Tradewinds Walkway Unit 4, San Jose, CA 95123 and is currently estimated at $536,740, approximately $672 per square foot. 5486 Tradewinds Walkway Unit 4 is a home located in Santa Clara County with nearby schools including Hayes Elementary School, Davis (Caroline) Intermediate School, and Oak Grove High School.
Ownership History
Date
Name
Owned For
Owner Type
Purchase Details
Closed on
May 22, 2018
Sold by
Sanchez Jose David and Sanchez Abiu
Bought by
Sanchez Joann L and Sanchez Alfonso P
Current Estimated Value
Home Financials for this Owner
Home Financials are based on the most recent Mortgage that was taken out on this home.
Original Mortgage
$691,543
Outstanding Balance
$595,441
Interest Rate
4.4%
Mortgage Type
FHA
Estimated Equity
-$58,701
Purchase Details
Closed on
Apr 17, 2002
Sold by
Mcmillian Steven E
Bought by
Sanchez Jose David and Sanchez Abiu
Home Financials for this Owner
Home Financials are based on the most recent Mortgage that was taken out on this home.
Original Mortgage
$172,000
Interest Rate
6.99%
Purchase Details
Closed on
Feb 3, 1997
Sold by
Roozen Kaye L
Bought by
Mcmillian Steven E
Home Financials for this Owner
Home Financials are based on the most recent Mortgage that was taken out on this home.
Original Mortgage
$90,780
Interest Rate
7.62%
Mortgage Type
VA
Create a Home Valuation Report for This Property
The Home Valuation Report is an in-depth analysis detailing your home's value as well as a comparison with similar homes in the area
Home Values in the Area
Average Home Value in this Area
Purchase History
| Date | Buyer | Sale Price | Title Company |
|---|---|---|---|
| Sanchez Joann L | -- | None Available | |
| Sanchez Jose David | $215,000 | North American Title Co | |
| Mcmillian Steven E | $91,000 | Old Republic Title Company |
Source: Public Records
Mortgage History
| Date | Status | Borrower | Loan Amount |
|---|---|---|---|
| Open | Sanchez Joann L | $691,543 | |
| Closed | Sanchez Jose David | $172,000 | |
| Previous Owner | Mcmillian Steven E | $90,780 | |
| Closed | Sanchez Jose David | $43,000 |
Source: Public Records
Tax History Compared to Growth
Tax History
| Year | Tax Paid | Tax Assessment Tax Assessment Total Assessment is a certain percentage of the fair market value that is determined by local assessors to be the total taxable value of land and additions on the property. | Land | Improvement |
|---|---|---|---|---|
| 2025 | $4,427 | $317,593 | $175,785 | $141,808 |
| 2024 | $4,427 | $311,367 | $172,339 | $139,028 |
| 2023 | $4,352 | $305,262 | $168,960 | $136,302 |
| 2022 | $4,342 | $299,278 | $165,648 | $133,630 |
| 2021 | $4,281 | $293,410 | $162,400 | $131,010 |
| 2020 | $4,217 | $290,402 | $160,735 | $129,667 |
| 2019 | $4,131 | $284,709 | $157,584 | $127,125 |
| 2018 | $4,105 | $279,128 | $154,495 | $124,633 |
| 2017 | $4,051 | $273,656 | $151,466 | $122,190 |
| 2016 | $3,848 | $268,292 | $148,497 | $119,795 |
| 2015 | $3,754 | $264,263 | $146,267 | $117,996 |
| 2014 | $3,550 | $259,087 | $143,402 | $115,685 |
Source: Public Records
Map
Nearby Homes
- 224 Coy Dr Unit 1
- 262 Tradewinds Ct Unit 4
- 275 Tradewinds Dr Unit 11
- 5558 Judith St Unit 1
- 285 Tradewinds Dr Unit 6
- 310 Tradewinds Dr Unit 8
- 309 Tradewinds Dr Unit 3
- 5503 Eagles Ln Unit 2
- 341 Blossom Hill Rd Unit 3
- 196 Coy Dr Unit 1
- 201 Pecan Grove Ct
- 291 Tradewinds Dr Unit 7
- 5532 Spinnaker Dr Unit 2
- 329 Blossom Hill Rd Unit 4
- 303 Tradewinds Dr Unit 10
- 5476 Sean Cir Unit 7
- 5506 Sean Cir Unit 112
- 323 Blossom Hill Rd Unit 2
- 5629 Judith St
- 236 Cheris Dr
- 5486 Tradewinds Walkway Unit 2
- 5486 Tradewinds Walkway Unit 3
- 5486 Tradewinds Walkway Unit 1
- 5486 Tradewinds Walkway
- 5486 Tradewinds Ww Unit 1
- 5480 Tradewinds Walkway
- 5480 Tradewinds Ww Unit 1
- 5480 Tradewinds Ww Unit 2
- 5480 Tradewinds Ww Unit 3
- 5480 Tradewinds Walkway Unit 4
- 5480 Tradewinds Walkway Unit 1
- 5480 Tradewinds Walkway Unit 3
- 5492 Tradewinds Walkway Unit 2
- 5492 Tradewinds Walkway Unit 1
- 5492 Tradewinds Ww Unit 3
- 5474 Tradewinds Walkway Unit 3
- 5474 Tradewinds Walkway Unit 4
- 5474 Tradewinds Walkway Unit 3
- 5474 Tradewinds Walkway Unit 2
- 5474 Tradewinds Walkway Unit 1