D
Seller's Agent in 2025
Dale Rehfeld
Engel & Völkers
(626) 255-3148
1 in this area
25 Total Sales
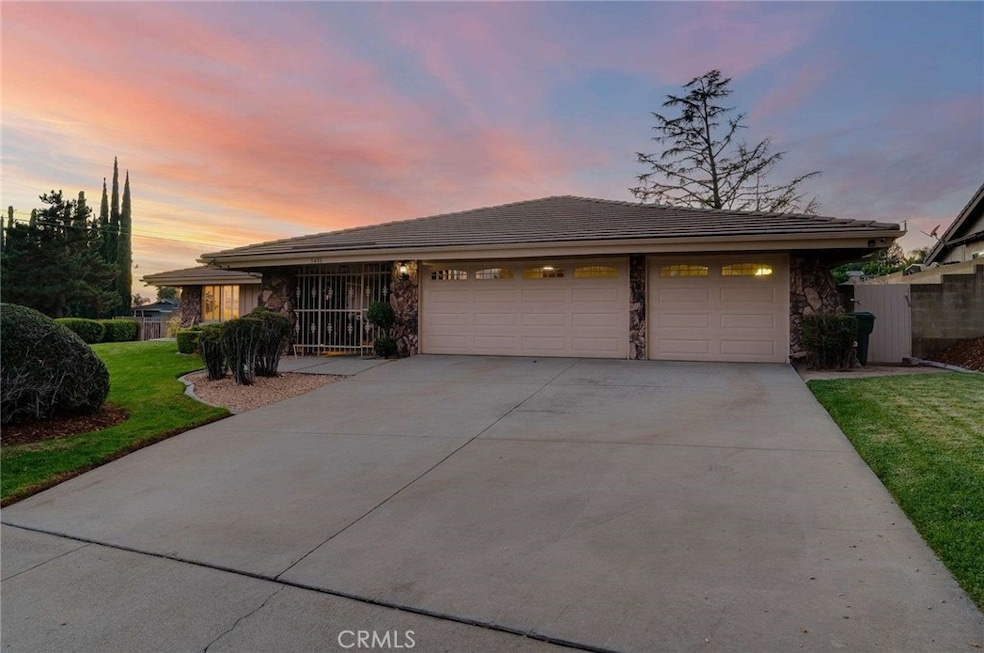
* This move-in ready residence located in Alta Loma offers an exceptional setting for outdoor entertaining with a huge lot and a gated Equestrian Access at the rear of the property. The home features four bedrooms, two bathrooms, 2,187 square feet of living space, and sits on a 17,600 square foot lot. The real bonus is the detached 30' x 30' RV Barn great for Storage or possible ADU. A true Handyman's dream. This is the first time on the market in 48 years - originally a Gary Miller model home with only one owner. Spacious formal living and dining room as well as an open beam ceiling with stone fireplace in the adjoining family room. This single story home is ideal for families and friend gatherings. The kitchen includes an eat-in breakfast counter, GE oven, Microwave and a 5-burner cooktop and Granite Countertops. Elegant hardwood flooring runs throughout the family room, hallway and three bedrooms. Additional amenities include an oversized three-car garage with a workbench, as well as a gated, paved 45' x 60' RV area adjacent to the RV Barn. The inground spa sits at the end of the lattice covered patio and landscaped grounds. There is also a detached 10’ x 12’ Tuff Shed in the rear yard. This property is conveniently located just 2 blocks North of the highly rated Stork Elementary School & located near dining, entertainment, and shopping venues just north of the 210 freeway and West of the 15 freeway.
Last Agent to Sell the Property
Engel & Völkers Brokerage Phone: 626-255-3148 License #00942231 Listed on: 12/03/2025

| Date | Type | Sale Price | Title Company |
|---|---|---|---|
| Grant Deed | $1,100,000 | Orange Coast Title Company | |
| Quit Claim Deed | -- | None Listed On Document | |
| Interfamily Deed Transfer | -- | None Available | |
| Interfamily Deed Transfer | -- | None Available | |
| Interfamily Deed Transfer | -- | -- | |
| Interfamily Deed Transfer | -- | -- | |
| Interfamily Deed Transfer | -- | -- |
| Date | Status | Loan Amount | Loan Type |
|---|---|---|---|
| Open | $935,000 | New Conventional |
| Date | Event | Price | List to Sale | Price per Sq Ft |
|---|---|---|---|---|
| 12/29/2025 12/29/25 | Sold | $1,100,000 | +11.2% | $503 / Sq Ft |
| 12/07/2025 12/07/25 | Pending | -- | -- | -- |
| 12/03/2025 12/03/25 | For Sale | $989,000 | -- | $452 / Sq Ft |
| Year | Tax Paid | Tax Assessment Tax Assessment Total Assessment is a certain percentage of the fair market value that is determined by local assessors to be the total taxable value of land and additions on the property. | Land | Improvement |
|---|---|---|---|---|
| 2025 | $2,329 | $206,690 | $36,970 | $169,720 |
| 2024 | $2,271 | $202,637 | $36,245 | $166,392 |
| 2023 | $2,220 | $198,663 | $35,534 | $163,129 |
| 2022 | $2,214 | $194,767 | $34,837 | $159,930 |
| 2021 | $2,213 | $190,948 | $34,154 | $156,794 |
| 2020 | $2,123 | $188,990 | $33,804 | $155,186 |
| 2019 | $2,147 | $185,284 | $33,141 | $152,143 |
| 2018 | $2,100 | $181,651 | $32,491 | $149,160 |
| 2017 | $2,005 | $178,089 | $31,854 | $146,235 |
| 2016 | $1,952 | $174,597 | $31,229 | $143,368 |
| 2015 | $1,939 | $171,974 | $30,760 | $141,214 |
| 2014 | $1,885 | $168,605 | $30,157 | $138,448 |
D
Seller's Agent in 2025
Dale Rehfeld
Engel & Völkers
(626) 255-3148
1 in this area
25 Total Sales
Buyer's Agent in 2025
JASON LORGE
KW THE FOOTHILLS
(714) 686-5807
13 in this area
265 Total Sales
B
Buyer Co-Listing Agent in 2025
BRIANA LORGE
KW THE FOOTHILLS
(909) 267-7300
8 in this area
182 Total Sales
Source: California Regional Multiple Listing Service (CRMLS)
MLS Number: CV25258883
APN: 1061-131-25
Disclaimer: Certain information contained herein is derived from information provided by parties other than Homes.com. All information provided is deemed reliable, but is not guaranteed to be accurate and should be independently verified.
![]() The multiple listing data appearing on this website, or contained in reports produced therefrom, is owned and copyrighted by California Regional Multiple Listing Service, Inc. ("CRMLS") and is protected by all applicable copyright laws. Information provided is for viewer's personal, non-commercial use and may not be used for any purpose other than to identify prospective properties the viewer may be interested in purchasing. All listing data, including but not limited to square footage and lot size is believed to be accurate, but the listing Agent, listing Broker and CRMLS and its affiliates do not warrant or guarantee such accuracy. The viewer should independently verify the listed data prior to making any decisions based on such information by personal inspection and/or contacting a real estate professional.
The multiple listing data appearing on this website, or contained in reports produced therefrom, is owned and copyrighted by California Regional Multiple Listing Service, Inc. ("CRMLS") and is protected by all applicable copyright laws. Information provided is for viewer's personal, non-commercial use and may not be used for any purpose other than to identify prospective properties the viewer may be interested in purchasing. All listing data, including but not limited to square footage and lot size is believed to be accurate, but the listing Agent, listing Broker and CRMLS and its affiliates do not warrant or guarantee such accuracy. The viewer should independently verify the listed data prior to making any decisions based on such information by personal inspection and/or contacting a real estate professional.
Based on information from California Regional Multiple Listing Service, Inc. and /or other sources. All data, including all measurements and calculations of area, is obtained from various sources and has not been, and will not be, verified by broker or MLS. All information should be independently reviewed and verified for accuracy. Properties may or may not be listed by the office/agent presenting the information
Ask me questions while you tour the home.