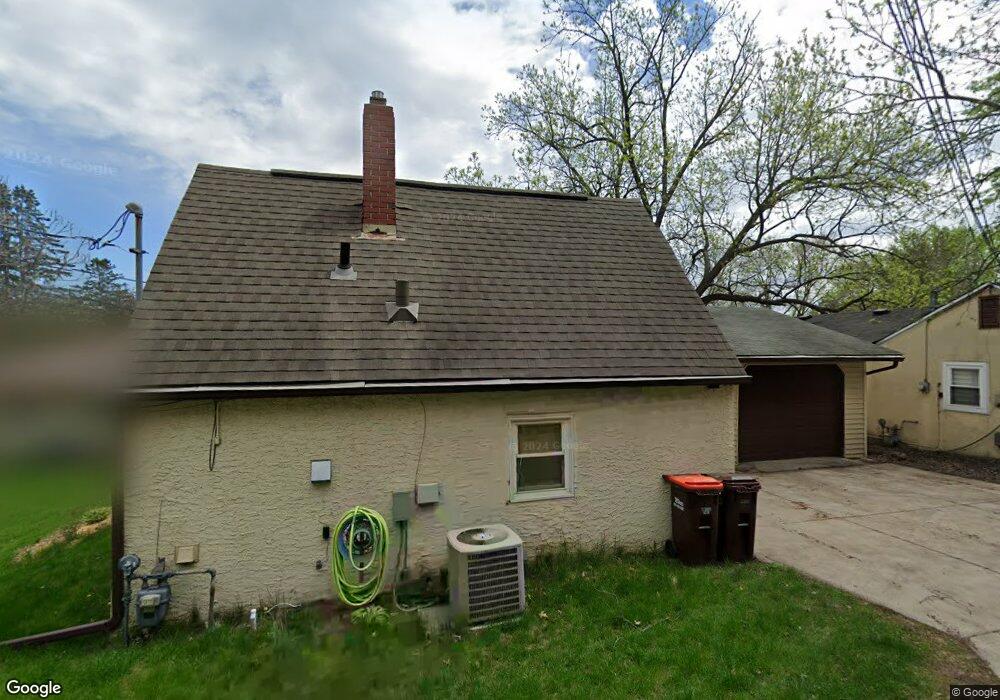
549 18th Ave N South Saint Paul, MN 55075
Estimated Value: $244,762 - $271,000
2
Beds
1
Bath
996
Sq Ft
$258/Sq Ft
Est. Value
About This Home
This home is located at 549 18th Ave N, South Saint Paul, MN 55075 and is currently estimated at $257,191, approximately $258 per square foot. 549 18th Ave N is a home located in Dakota County with nearby schools including Lincoln Center Elementary, South St. Paul Secondary, and Academic Arts High School.
Ownership History
Date
Name
Owned For
Owner Type
Purchase Details
Closed on
Aug 1, 2018
Sold by
Hoffman Andrew and Christensen Caryn
Bought by
Jorgenson Benjamin P
Current Estimated Value
Home Financials for this Owner
Home Financials are based on the most recent Mortgage that was taken out on this home.
Original Mortgage
$165,150
Outstanding Balance
$143,426
Interest Rate
4.5%
Mortgage Type
New Conventional
Estimated Equity
$113,765
Purchase Details
Closed on
Jul 30, 2007
Sold by
Cartwright Bethany
Bought by
Hoffman Andrew
Purchase Details
Closed on
Jun 3, 2002
Sold by
Cartwright Sharon K
Bought by
Cartwright Bethany L
Purchase Details
Closed on
Dec 30, 1998
Sold by
Trummer Elizabeth J
Bought by
Cartwright Sharon K
Purchase Details
Closed on
Oct 15, 1996
Sold by
Wrich Thomas Leo
Bought by
Trummer Elisabeth J
Create a Home Valuation Report for This Property
The Home Valuation Report is an in-depth analysis detailing your home's value as well as a comparison with similar homes in the area
Home Values in the Area
Average Home Value in this Area
Purchase History
| Date | Buyer | Sale Price | Title Company |
|---|---|---|---|
| Jorgenson Benjamin P | $183,500 | Edina Realty Title Inc | |
| Hoffman Andrew | $164,000 | -- | |
| Cartwright Bethany L | $100,000 | -- | |
| Cartwright Sharon K | $72,000 | -- | |
| Trummer Elisabeth J | $61,275 | -- |
Source: Public Records
Mortgage History
| Date | Status | Borrower | Loan Amount |
|---|---|---|---|
| Open | Jorgenson Benjamin P | $165,150 |
Source: Public Records
Tax History Compared to Growth
Tax History
| Year | Tax Paid | Tax Assessment Tax Assessment Total Assessment is a certain percentage of the fair market value that is determined by local assessors to be the total taxable value of land and additions on the property. | Land | Improvement |
|---|---|---|---|---|
| 2024 | $2,720 | $205,500 | $60,400 | $145,100 |
| 2023 | $2,720 | $209,100 | $60,800 | $148,300 |
| 2022 | $2,212 | $202,700 | $60,700 | $142,000 |
| 2021 | $2,036 | $177,400 | $52,800 | $124,600 |
| 2020 | $2,006 | $162,800 | $50,300 | $112,500 |
| 2019 | $1,778 | $164,300 | $47,900 | $116,400 |
| 2018 | $1,775 | $143,600 | $43,600 | $100,000 |
| 2017 | $1,514 | $138,200 | $41,500 | $96,700 |
| 2016 | $1,566 | $125,000 | $37,700 | $87,300 |
| 2015 | $1,549 | $97,593 | $28,323 | $69,270 |
| 2014 | -- | $102,716 | $28,719 | $73,997 |
| 2013 | -- | $84,295 | $23,890 | $60,405 |
Source: Public Records
Map
Nearby Homes
- 436 17th Ave N
- 522 16th Ave N
- 425 16th Ave N
- 2205 Acorn Ln
- 601 Levander Way Unit 101
- 601 Levander Way Unit 208
- 606 13th Ave N
- 1200 Dwane St
- 818 16th Ave N
- 352 12th Ave N
- 921 17th Ave N
- 114 20th Ave N
- 934 15th Ave N
- 916 4th St N
- 212 11th Ave N
- 119 22nd Ave S
- 127 16th Ave S
- 1010 Summit Ave
- 518 8th Ave N
- 1044 17th Ave N
- 553 553 18th Ave N
- 553 18th Ave N
- 543 18th Ave N
- 559 18th Ave N
- 537 18th Ave N
- 537 537 18th-Avenue-n
- 537 537 18th Ave N
- 548 19th Ave N
- 542 19th Ave N
- 533 18th Ave N
- 554 19th Ave N
- 542 542 N 19th-Avenue-
- 542 19th Ave N
- 3XX 18th Ave N
- 536 19th Ave N
- 536 536 19th-Avenue-n
- 536 536 19th Ave N
- 550 18th Ave N
- 544 18th Ave N
- 1725 Congress St