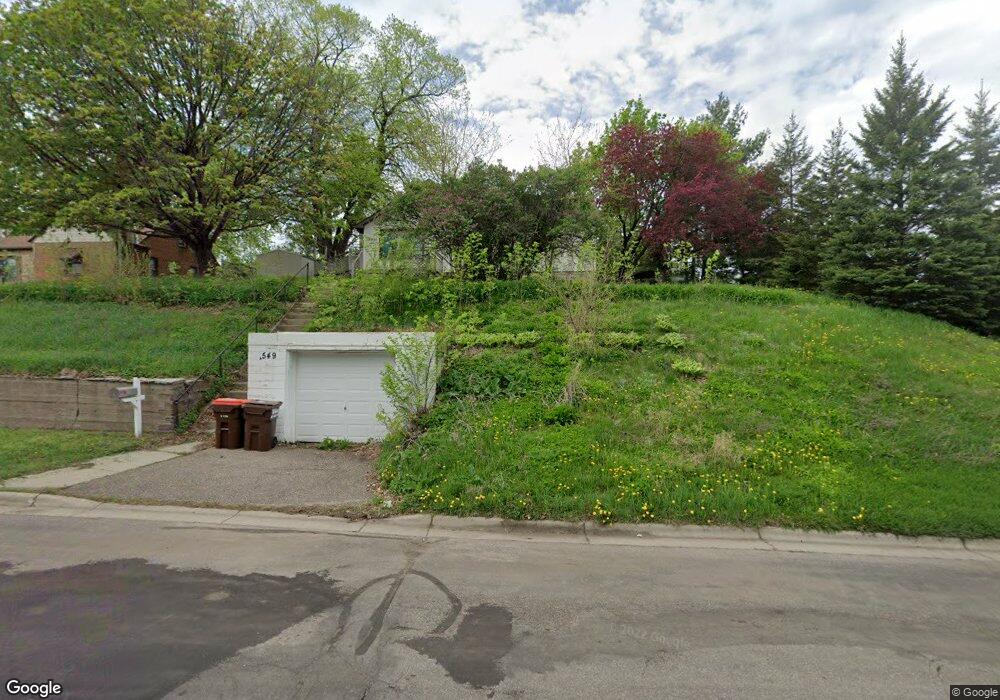
549 19th Ave N South Saint Paul, MN 55075
Estimated Value: $295,000 - $321,000
4
Beds
2
Baths
1,309
Sq Ft
$234/Sq Ft
Est. Value
About This Home
This home is located at 549 19th Ave N, South Saint Paul, MN 55075 and is currently estimated at $306,881, approximately $234 per square foot. 549 19th Ave N is a home located in Dakota County with nearby schools including Lincoln Center Elementary, South St. Paul Secondary, and Academic Arts High School.
Ownership History
Date
Name
Owned For
Owner Type
Purchase Details
Closed on
Nov 22, 2016
Sold by
Stachowiak Neil and Hernandez Megan
Bought by
Gulierrez Leonel Del Rio
Current Estimated Value
Home Financials for this Owner
Home Financials are based on the most recent Mortgage that was taken out on this home.
Original Mortgage
$151,810
Outstanding Balance
$123,558
Interest Rate
3.78%
Mortgage Type
Unknown
Estimated Equity
$183,323
Purchase Details
Closed on
Jun 28, 2013
Sold by
Solos Brian Brian
Bought by
Stachowiak Neil Neil
Home Financials for this Owner
Home Financials are based on the most recent Mortgage that was taken out on this home.
Original Mortgage
$162,000
Interest Rate
4.46%
Purchase Details
Closed on
Feb 7, 2013
Sold by
Lpp Mortgage Ltd
Bought by
Solos Brian
Purchase Details
Closed on
Nov 4, 2011
Sold by
Zajec Michelle M
Bought by
Lpp Mortgage Ltd
Purchase Details
Closed on
Aug 7, 2003
Sold by
Truax Pegann Marie
Bought by
Zajec Michelle
Create a Home Valuation Report for This Property
The Home Valuation Report is an in-depth analysis detailing your home's value as well as a comparison with similar homes in the area
Home Values in the Area
Average Home Value in this Area
Purchase History
| Date | Buyer | Sale Price | Title Company |
|---|---|---|---|
| Gulierrez Leonel Del Rio | $159,800 | North American Title Company | |
| Stachowiak Neil Neil | $162,000 | -- | |
| Solos Brian | $97,000 | Prism Title & Closing Servic | |
| Lpp Mortgage Ltd | $246,409 | None Available | |
| Zajec Michelle | $187,996 | -- |
Source: Public Records
Mortgage History
| Date | Status | Borrower | Loan Amount |
|---|---|---|---|
| Open | Gulierrez Leonel Del Rio | $151,810 | |
| Closed | Gulierrez Leonel Del Rio | $151,810 | |
| Previous Owner | Stachowiak Neil Neil | $162,000 |
Source: Public Records
Tax History Compared to Growth
Tax History
| Year | Tax Paid | Tax Assessment Tax Assessment Total Assessment is a certain percentage of the fair market value that is determined by local assessors to be the total taxable value of land and additions on the property. | Land | Improvement |
|---|---|---|---|---|
| 2024 | $4,774 | $294,500 | $94,400 | $200,100 |
| 2023 | $4,134 | $298,500 | $95,000 | $203,500 |
| 2022 | $3,376 | $294,500 | $94,900 | $199,600 |
| 2021 | $3,386 | $254,900 | $82,600 | $172,300 |
| 2020 | $3,342 | $236,600 | $78,600 | $158,000 |
| 2019 | $2,878 | $243,500 | $84,700 | $158,800 |
| 2018 | $3,249 | $214,000 | $77,000 | $137,000 |
| 2017 | $2,412 | $203,200 | $73,400 | $129,800 |
| 2016 | $2,939 | $180,700 | $66,700 | $114,000 |
| 2015 | $2,630 | $170,623 | $56,815 | $113,808 |
| 2014 | -- | $169,424 | $56,743 | $112,681 |
| 2013 | -- | $150,131 | $48,821 | $101,310 |
Source: Public Records
Map
Nearby Homes
- 436 17th Ave N
- 522 16th Ave N
- 2205 Acorn Ln
- 425 16th Ave N
- 601 Levander Way Unit 101
- 601 Levander Way Unit 208
- 606 13th Ave N
- 1200 Dwane St
- 818 16th Ave N
- 921 17th Ave N
- 352 12th Ave N
- 114 20th Ave N
- 934 15th Ave N
- 362 Trenton Ln
- 1518 Traverse Ln
- 358 Trenton Ln
- 1537 Traverse Ln
- 364 Trenton Ln
- 1523 Traverse Ln
- 360 Trenton Ln
- 549 549 19th-Avenue-n
- 549 549 19th Ave N
- 554 554 19th Ave N
- 543 19th Ave N
- 550 20th Ave N
- 605 19th Ave N
- 542 19th Ave N
- 554 19th Ave N
- 548 19th Ave N
- 542 542 N 19th-Avenue-
- 539 19th Ave N
- 542 19th Ave N
- 536 536 19th-Avenue-n
- 536 536 19th Ave N
- 611 19th Ave N
- 536 19th Ave N
- 535 535 19th-Avenue-n
- 535 535 19th Ave N
- 535 19th Ave N
- 1926 Congress St