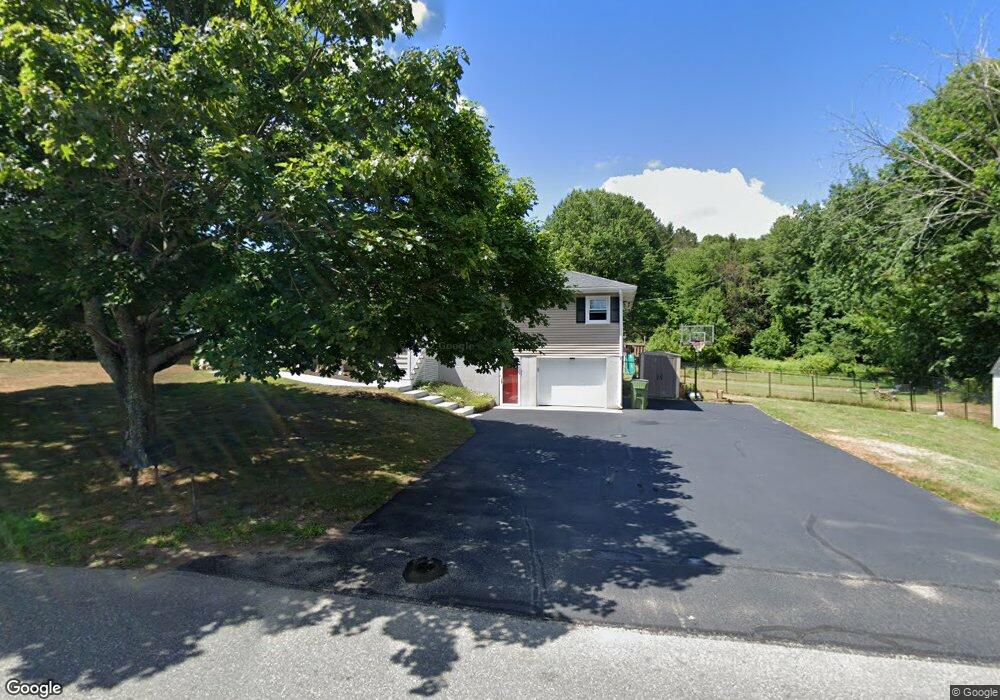
549 Highland St Northbridge, MA 01534
Estimated Value: $534,000 - $636,894
2
Beds
2
Baths
869
Sq Ft
$671/Sq Ft
Est. Value
About This Home
This home is located at 549 Highland St, Northbridge, MA 01534 and is currently estimated at $582,974, approximately $670 per square foot. 549 Highland St is a home located in Worcester County with nearby schools including Northbridge Elementary School, Northbridge Middle School, and Northbridge High School.
Ownership History
Date
Name
Owned For
Owner Type
Purchase Details
Closed on
May 2, 2014
Sold by
Lubas Helen M Est and Patnode
Bought by
Williamson Joseph A and Williamson Jane M
Current Estimated Value
Purchase Details
Closed on
Apr 6, 2009
Sold by
Lubas Leo J and Lubas Helen M
Bought by
Lubas Helen M
Create a Home Valuation Report for This Property
The Home Valuation Report is an in-depth analysis detailing your home's value as well as a comparison with similar homes in the area
Home Values in the Area
Average Home Value in this Area
Purchase History
| Date | Buyer | Sale Price | Title Company |
|---|---|---|---|
| Williamson Joseph A | $180,000 | -- | |
| Williamson Joseph A | $180,000 | -- | |
| Lubas Helen M | -- | -- | |
| Lubas Helen M | -- | -- |
Source: Public Records
Tax History Compared to Growth
Tax History
| Year | Tax Paid | Tax Assessment Tax Assessment Total Assessment is a certain percentage of the fair market value that is determined by local assessors to be the total taxable value of land and additions on the property. | Land | Improvement |
|---|---|---|---|---|
| 2025 | $6,031 | $511,500 | $154,700 | $356,800 |
| 2024 | $5,715 | $472,700 | $154,700 | $318,000 |
| 2023 | $5,831 | $449,900 | $154,700 | $295,200 |
| 2022 | $5,361 | $389,300 | $119,100 | $270,200 |
| 2021 | $3,260 | $356,700 | $113,500 | $243,200 |
| 2020 | $0 | $346,300 | $113,500 | $232,800 |
| 2019 | $0 | $322,800 | $113,500 | $209,300 |
| 2018 | $2,973 | $307,400 | $107,900 | $199,500 |
| 2017 | $3,959 | $292,600 | $107,900 | $184,700 |
| 2016 | $3,743 | $272,200 | $98,100 | $174,100 |
| 2015 | $3,560 | $266,100 | $98,100 | $168,000 |
| 2014 | $3,528 | $266,100 | $98,100 | $168,000 |
Source: Public Records
Map
Nearby Homes
- 135 Windstone Dr
- 119 Susanne Dr
- 86 Kingsnorth St
- 157 Rolling Ridge Dr Unit 84
- 708 Marston Rd
- 192 Rebecca Rd
- 1076 Hill St
- 46 Rebecca Rd
- 73 Plummer Ave
- 731 Samuel Dr
- 1880 Providence Rd
- 151 Fowler Rd
- 0 Puddon St
- 140 Rolling Ridge Dr Unit 78
- 33 Crestwood Cir Unit 45
- 169 Rolling Ridge Dr Unit 97
- 5 Summit St
- 39 Crestwood Cir Unit 42
- 159 Rolling Ridge Dr Unit 85
- 21 Granite St
- 403 Benson Rd
- 401 Benson Rd
- 527 Highland St
- 546 Highland St
- 560 Highland St
- 402 Benson Rd
- 566 Highland St
- 391 Benson Rd
- 579 Highland St
- 522 Highland St
- 517 Highland St
- 576 Highland St
- 11 Freedoms Way
- 377 Benson Rd
- 384 Benson Rd
- 582 Highland St
- 603 Highland St
- 508 Highland St
- 440 Benson Rd
- 503 Highland St