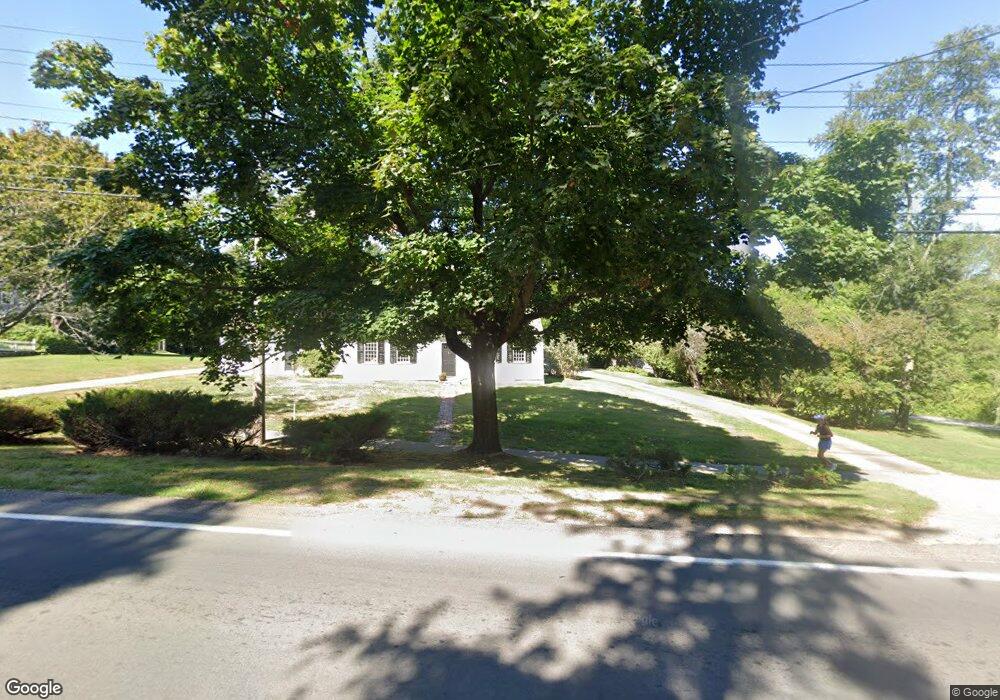
549 Main St Hingham, MA 02043
Estimated Value: $1,204,000 - $1,352,276
3
Beds
4
Baths
2,602
Sq Ft
$485/Sq Ft
Est. Value
About This Home
This home is located at 549 Main St, Hingham, MA 02043 and is currently estimated at $1,262,569, approximately $485 per square foot. 549 Main St is a home located in Plymouth County with nearby schools including East Elementary School, Hingham Middle School, and Hingham High School.
Ownership History
Date
Name
Owned For
Owner Type
Purchase Details
Closed on
May 3, 2007
Sold by
Otis Gail P and Hoffm Jane
Bought by
549 Main Street Rt and Donovan Brian J
Current Estimated Value
Home Financials for this Owner
Home Financials are based on the most recent Mortgage that was taken out on this home.
Original Mortgage
$410,000
Outstanding Balance
$250,206
Interest Rate
6.23%
Mortgage Type
Purchase Money Mortgage
Estimated Equity
$1,012,363
Purchase Details
Closed on
Jan 19, 2000
Sold by
Joan M Oconnor T and Oconnor David J
Bought by
Hoffman Jeffrey L and Hoffman Jane E
Purchase Details
Closed on
Apr 26, 1996
Sold by
Ramsdell David H and Ramsdell Susan L
Bought by
Oconnor David J and Oconnor Joan M
Create a Home Valuation Report for This Property
The Home Valuation Report is an in-depth analysis detailing your home's value as well as a comparison with similar homes in the area
Purchase History
| Date | Buyer | Sale Price | Title Company |
|---|---|---|---|
| 549 Main Street Rt | $655,000 | -- | |
| Hoffman Jeffrey L | $499,000 | -- | |
| Oconnor David J | $342,000 | -- |
Source: Public Records
Mortgage History
| Date | Status | Borrower | Loan Amount |
|---|---|---|---|
| Open | Oconnor David J | $250,000 | |
| Open | Oconnor David J | $410,000 |
Source: Public Records
Tax History
| Year | Tax Paid | Tax Assessment Tax Assessment Total Assessment is a certain percentage of the fair market value that is determined by local assessors to be the total taxable value of land and additions on the property. | Land | Improvement |
|---|---|---|---|---|
| 2025 | $12,124 | $1,134,100 | $545,300 | $588,800 |
| 2024 | $11,623 | $1,071,200 | $545,300 | $525,900 |
| 2023 | $10,027 | $1,002,700 | $545,300 | $457,400 |
| 2022 | $9,601 | $830,500 | $450,200 | $380,300 |
| 2021 | $9,218 | $781,200 | $450,200 | $331,000 |
| 2020 | $9,007 | $781,200 | $450,200 | $331,000 |
| 2019 | $8,902 | $753,800 | $450,200 | $303,600 |
| 2018 | $8,792 | $747,000 | $450,200 | $296,800 |
| 2017 | $8,952 | $730,800 | $447,800 | $283,000 |
| 2016 | $8,863 | $709,600 | $426,600 | $283,000 |
| 2015 | $8,636 | $689,200 | $406,200 | $283,000 |
Source: Public Records
Map
Nearby Homes
- 16 Woodbridge Rd
- 557 Main St
- 557 Main St Unit 557-559
- 565 Main St
- 17 Woodbridge Rd
- 567 Main St
- 559 Main St
- 15 Woodbridge Rd
- 12 Towerbrook Rd
- 14 Woodbridge Rd
- 562 Main St
- 14 Towerbrook Rd
- 573 Main St
- 16 Tower Brook Rd
- 570 Main St
- 12 Woodbridge Rd
- 9 Towerbrook Rd
- 566 Main St
- 16 Towerbrook Rd
- 11 Towerbrook Rd
Your Personal Tour Guide
Ask me questions while you tour the home.