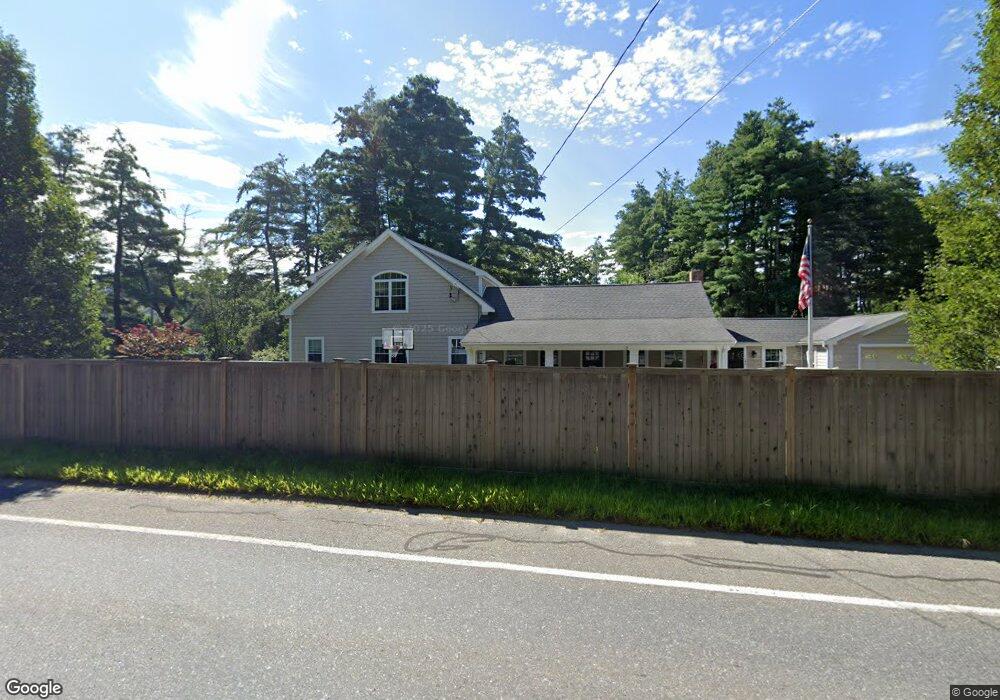
549 Main St Hudson, MA 01749
Estimated Value: $611,000 - $705,000
3
Beds
1
Bath
2,000
Sq Ft
$333/Sq Ft
Est. Value
About This Home
This home is located at 549 Main St, Hudson, MA 01749 and is currently estimated at $665,420, approximately $332 per square foot. 549 Main St is a home located in Middlesex County with nearby schools including David J. Quinn Middle School, Hudson High School, and First Steps Children's Center.
Ownership History
Date
Name
Owned For
Owner Type
Purchase Details
Closed on
Mar 27, 2009
Sold by
Wooldridge Mary E
Bought by
Gibson Travis C and Bryan Stephanie A
Current Estimated Value
Home Financials for this Owner
Home Financials are based on the most recent Mortgage that was taken out on this home.
Original Mortgage
$223,250
Outstanding Balance
$142,639
Interest Rate
5.14%
Mortgage Type
Purchase Money Mortgage
Estimated Equity
$522,781
Create a Home Valuation Report for This Property
The Home Valuation Report is an in-depth analysis detailing your home's value as well as a comparison with similar homes in the area
Home Values in the Area
Average Home Value in this Area
Purchase History
| Date | Buyer | Sale Price | Title Company |
|---|---|---|---|
| Gibson Travis C | $235,000 | -- | |
| Gibson Travis C | $235,000 | -- |
Source: Public Records
Mortgage History
| Date | Status | Borrower | Loan Amount |
|---|---|---|---|
| Open | Gibson Travis C | $223,250 | |
| Closed | Gibson Travis C | $223,250 | |
| Previous Owner | Gibson Travis C | $100,000 | |
| Previous Owner | Gibson Travis C | $50,000 |
Source: Public Records
Tax History
| Year | Tax Paid | Tax Assessment Tax Assessment Total Assessment is a certain percentage of the fair market value that is determined by local assessors to be the total taxable value of land and additions on the property. | Land | Improvement |
|---|---|---|---|---|
| 2025 | $7,706 | $555,200 | $202,700 | $352,500 |
| 2024 | $7,115 | $508,200 | $184,200 | $324,000 |
| 2023 | $7,007 | $479,900 | $177,100 | $302,800 |
| 2022 | $6,886 | $434,200 | $161,000 | $273,200 |
| 2021 | $6,714 | $404,700 | $153,500 | $251,200 |
| 2020 | $6,250 | $376,300 | $150,500 | $225,800 |
| 2019 | $6,379 | $374,600 | $150,500 | $224,100 |
| 2018 | $4,207 | $340,400 | $143,400 | $197,000 |
| 2017 | $4,233 | $241,900 | $136,600 | $105,300 |
| 2016 | $4,499 | $260,200 | $136,600 | $123,600 |
| 2015 | $4,012 | $232,300 | $122,800 | $109,500 |
| 2014 | $3,791 | $217,600 | $107,600 | $110,000 |
Source: Public Records
Map
Nearby Homes
- 210 Barton Rd
- 9 & 9A Abigail
- 1 Town Line Rd
- 1 Town Line Rd Unit 18
- 8 Town Line Rd Unit 4
- 10 Old County Rd Unit 19
- 3 Shore Line Dr Unit 15
- 14 Old County Rd Unit 21
- 5 Shore Line Rd
- 51 Hale Rd
- 8 Shoreline Dr Unit 11
- 786 Main St
- 168 Blanchette Dr
- 34 Hallock Point Rd
- 788 Main St
- 1 Glendale Rd
- 84 Crosby Rd
- 7 Old North Rd
- 304 Cox St
- 425 Main St Unit 7C
Your Personal Tour Guide
Ask me questions while you tour the home.