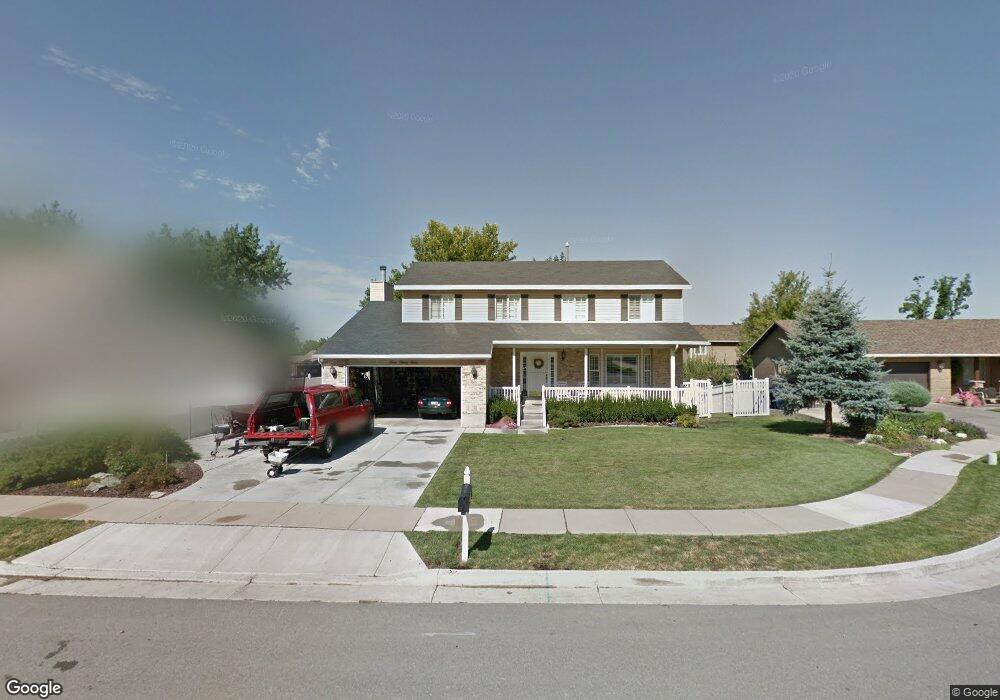
549 N 180 E Centerville, UT 84014
Estimated Value: $709,961 - $833,000
3
Beds
3
Baths
2,498
Sq Ft
$313/Sq Ft
Est. Value
About This Home
This home is located at 549 N 180 E, Centerville, UT 84014 and is currently estimated at $782,990, approximately $313 per square foot. 549 N 180 E is a home located in Davis County with nearby schools including Centerville Elementary, Centerville Jr High, and Viewmont High School.
Ownership History
Date
Name
Owned For
Owner Type
Purchase Details
Closed on
Nov 4, 2021
Sold by
Urry Brent M and Urry Joy C
Bought by
Urry Brent M and Urry Joy
Current Estimated Value
Create a Home Valuation Report for This Property
The Home Valuation Report is an in-depth analysis detailing your home's value as well as a comparison with similar homes in the area
Purchase History
| Date | Buyer | Sale Price | Title Company |
|---|---|---|---|
| Urry Brent M | -- | None Available |
Source: Public Records
Tax History
| Year | Tax Paid | Tax Assessment Tax Assessment Total Assessment is a certain percentage of the fair market value that is determined by local assessors to be the total taxable value of land and additions on the property. | Land | Improvement |
|---|---|---|---|---|
| 2025 | $3,818 | $365,200 | $168,155 | $197,045 |
| 2024 | $3,601 | $350,350 | $150,350 | $200,000 |
| 2023 | $3,442 | $605,000 | $247,661 | $357,339 |
| 2022 | $3,653 | $353,650 | $124,843 | $228,807 |
| 2021 | $3,157 | $476,000 | $189,303 | $286,697 |
| 2020 | $3,091 | $466,000 | $185,552 | $280,448 |
| 2019 | $3,158 | $465,000 | $188,234 | $276,766 |
| 2018 | $2,922 | $425,000 | $174,789 | $250,211 |
| 2016 | $2,583 | $208,781 | $57,338 | $151,443 |
| 2015 | $2,537 | $193,491 | $57,338 | $136,153 |
| 2014 | $2,895 | $188,100 | $57,338 | $130,762 |
| 2013 | -- | $154,252 | $48,624 | $105,628 |
Source: Public Records
Map
Nearby Homes
- 563 N 220 E
- 295 E 500 N
- 380 E 400 N
- 56 W 200 N
- 66 Brookside Ln
- 22 Creekside Ln
- 252 N 400 E
- 775 Pheasantbrook Cir
- 282 W 605 N Unit A
- 282 W 605 N Unit I
- 281 W 650 N Unit B
- 303 W 650 N Unit I
- 292 W 680 N
- 16 S 200 E
- 781 Pheasantbrook Dr
- 360 E Center St
- 984 N 500 E
- 328 E 1100 S
- 88 W 50 S Unit C-3
- 88 W 50 S Unit B5
Your Personal Tour Guide
Ask me questions while you tour the home.