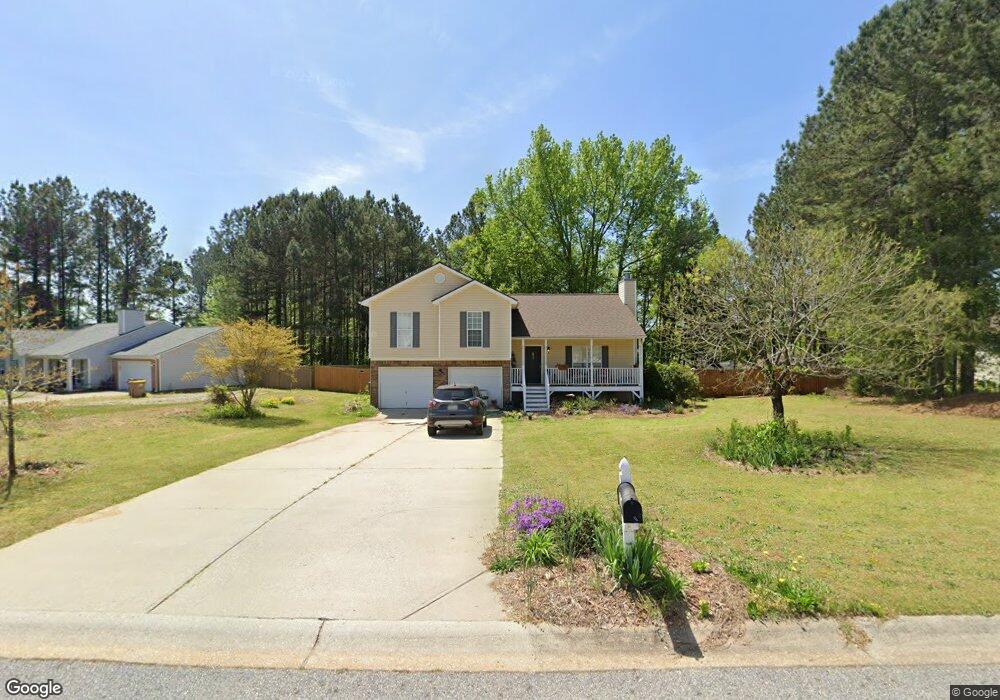
549 Pin Oak Dr Unit 2D Bethlehem, GA 30620
Estimated Value: $330,521 - $352,000
4
Beds
3
Baths
1,741
Sq Ft
$198/Sq Ft
Est. Value
About This Home
This home is located at 549 Pin Oak Dr Unit 2D, Bethlehem, GA 30620 and is currently estimated at $343,880, approximately $197 per square foot. 549 Pin Oak Dr Unit 2D is a home located in Barrow County with nearby schools including Yargo Elementary School, Haymon-Morris Middle School, and Apalachee High School.
Ownership History
Date
Name
Owned For
Owner Type
Purchase Details
Closed on
Oct 12, 2012
Sold by
Jpmorgan Chase Bank Na
Bought by
Peebles Heather Lee and Head Justin Daniel
Current Estimated Value
Home Financials for this Owner
Home Financials are based on the most recent Mortgage that was taken out on this home.
Original Mortgage
$80,023
Outstanding Balance
$54,730
Interest Rate
3.25%
Mortgage Type
FHA
Estimated Equity
$289,150
Purchase Details
Closed on
May 1, 2012
Sold by
Williams Colleen Mills
Bought by
Jpmorgan Chase Bank Na
Purchase Details
Closed on
Oct 3, 2003
Sold by
Southfork Hms Inc
Bought by
Williams Colleen M
Home Financials for this Owner
Home Financials are based on the most recent Mortgage that was taken out on this home.
Original Mortgage
$131,522
Interest Rate
6.32%
Mortgage Type
New Conventional
Purchase Details
Closed on
Aug 19, 2003
Sold by
Parkview Development Inc
Bought by
Southfork Homes Inc
Home Financials for this Owner
Home Financials are based on the most recent Mortgage that was taken out on this home.
Original Mortgage
$131,522
Interest Rate
6.32%
Mortgage Type
New Conventional
Purchase Details
Closed on
May 2, 2000
Bought by
Parkview Development Inc
Create a Home Valuation Report for This Property
The Home Valuation Report is an in-depth analysis detailing your home's value as well as a comparison with similar homes in the area
Home Values in the Area
Average Home Value in this Area
Purchase History
| Date | Buyer | Sale Price | Title Company |
|---|---|---|---|
| Peebles Heather Lee | $81,500 | -- | |
| Jpmorgan Chase Bank Na | -- | -- | |
| Williams Colleen M | $129,600 | -- | |
| Southfork Homes Inc | $280,000 | -- | |
| Parkview Development Inc | -- | -- |
Source: Public Records
Mortgage History
| Date | Status | Borrower | Loan Amount |
|---|---|---|---|
| Open | Peebles Heather Lee | $80,023 | |
| Previous Owner | Williams Colleen M | $131,522 |
Source: Public Records
Tax History Compared to Growth
Tax History
| Year | Tax Paid | Tax Assessment Tax Assessment Total Assessment is a certain percentage of the fair market value that is determined by local assessors to be the total taxable value of land and additions on the property. | Land | Improvement |
|---|---|---|---|---|
| 2024 | $2,889 | $114,403 | $25,200 | $89,203 |
| 2023 | $2,894 | $115,003 | $25,200 | $89,803 |
| 2022 | $2,436 | $82,746 | $20,000 | $62,746 |
| 2021 | $2,269 | $72,531 | $16,000 | $56,531 |
| 2020 | $2,026 | $64,245 | $16,000 | $48,245 |
| 2019 | $2,062 | $64,245 | $16,000 | $48,245 |
| 2018 | $1,955 | $61,445 | $13,200 | $48,245 |
| 2017 | $1,521 | $52,249 | $13,200 | $39,049 |
| 2016 | $1,467 | $45,861 | $13,200 | $32,661 |
| 2015 | $1,484 | $46,222 | $13,200 | $33,022 |
| 2014 | $1,333 | $39,850 | $6,468 | $33,382 |
| 2013 | -- | $37,749 | $6,468 | $31,281 |
Source: Public Records
Map
Nearby Homes
- 0 Jb Owens Unit 7552902
- 0 Jb Owens Unit 7552891
- 0 Jb Owens Unit LOT 2 - 2.09 ACRES
- 0 Jb Owens Unit LOT 3 - 2.01 ACRES
- 190 Lokeys Ln
- 303 Ron Dr
- 209 Angie Way
- 758 Clarence Edwards Rd
- 763 Moss Side Dr
- 0 Tanners Bridge Rd Unit 10588144
- 637 Sleeping Meadow Ln
- 1129 Loganville Hwy
- 286 Meadows Dr
- 1071 Covenant Ct
- 1111 Otis Dr
- 103 Camp Ct
- 384 Winslow Ct
- 1024 Lyndhurst Ln
- 575 Mackinaw Dr
- 1164 Otis Dr
- 549 Pin Oak Dr
- 1158 Locust Dr Unit 1D
- 1158 Locust Dr
- 1160 Locust Dr
- 1160 Locust Dr Unit 3
- 557 Pin Oak Dr Unit 4
- 557 Pin Oak Dr
- 548 Pin Oak Dr
- 548 Pin Oak Dr
- 550 Pin Oak Dr Unit 4A
- 550 Pin Oak Dr
- 552 Pin Oak Dr Unit 5A
- 552 Pin Oak Dr
- 546 Pin Oak Dr
- 559 Pin Oak Dr Unit 5D
- 559 Pin Oak Dr
- 1162 Locust Dr Unit 3
- 561 Pin Oak Dr Unit 3
- 0 Locust Dr Unit 7139246
- 0 Locust Dr Unit 3274757