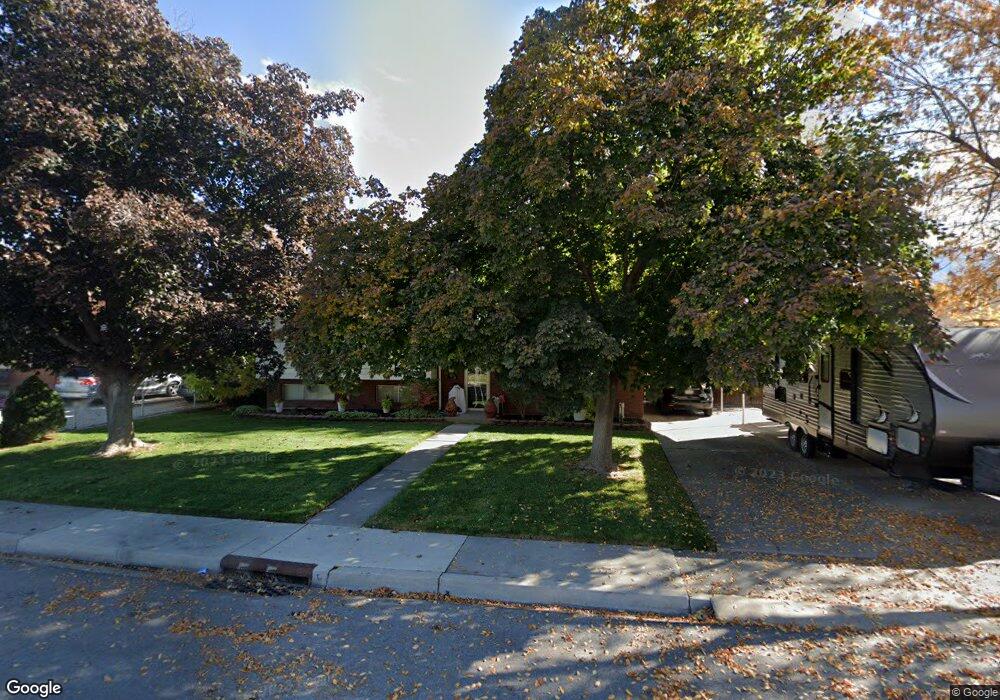
549 S 400 E Orem, UT 84097
SCERA NeighborhoodEstimated Value: $493,359 - $537,000
4
Beds
3
Baths
1,812
Sq Ft
$283/Sq Ft
Est. Value
About This Home
This home is located at 549 S 400 E, Orem, UT 84097 and is currently estimated at $513,120, approximately $283 per square foot. 549 S 400 E is a home located in Utah County with nearby schools including Centennial Elementary, Lakeridge Jr High School, and Orem High School.
Ownership History
Date
Name
Owned For
Owner Type
Purchase Details
Closed on
May 17, 2016
Sold by
Pratt Richard W
Bought by
Pratt Richard W and Pratt Sylvia F
Current Estimated Value
Purchase Details
Closed on
Jan 20, 2005
Sold by
Jp Morgan Chase Bank
Bought by
Pratt Richard
Home Financials for this Owner
Home Financials are based on the most recent Mortgage that was taken out on this home.
Original Mortgage
$28,000
Interest Rate
5.74%
Mortgage Type
Stand Alone Second
Purchase Details
Closed on
Jan 3, 2005
Sold by
Thomas J Carl and Thomas Toni K
Bought by
Jp Morgan Chase Bank
Home Financials for this Owner
Home Financials are based on the most recent Mortgage that was taken out on this home.
Original Mortgage
$28,000
Interest Rate
5.74%
Mortgage Type
Stand Alone Second
Create a Home Valuation Report for This Property
The Home Valuation Report is an in-depth analysis detailing your home's value as well as a comparison with similar homes in the area
Home Values in the Area
Average Home Value in this Area
Purchase History
| Date | Buyer | Sale Price | Title Company |
|---|---|---|---|
| Pratt Richard W | -- | None Available | |
| Pratt Richard | -- | Inwest Title Services Sal | |
| Jp Morgan Chase Bank | $137,016 | First American Title Co |
Source: Public Records
Mortgage History
| Date | Status | Borrower | Loan Amount |
|---|---|---|---|
| Closed | Pratt Richard | $28,000 | |
| Open | Pratt Richard | $112,000 |
Source: Public Records
Tax History
| Year | Tax Paid | Tax Assessment Tax Assessment Total Assessment is a certain percentage of the fair market value that is determined by local assessors to be the total taxable value of land and additions on the property. | Land | Improvement |
|---|---|---|---|---|
| 2025 | $1,883 | $234,080 | -- | -- |
| 2024 | $1,883 | $230,230 | $0 | $0 |
| 2023 | $1,752 | $230,285 | $0 | $0 |
| 2022 | $1,748 | $222,585 | $0 | $0 |
| 2021 | $1,620 | $312,500 | $139,400 | $173,100 |
| 2020 | $1,484 | $281,200 | $111,500 | $169,700 |
| 2019 | $1,389 | $273,800 | $104,100 | $169,700 |
| 2018 | $1,327 | $249,900 | $100,400 | $149,500 |
| 2017 | $1,263 | $127,435 | $0 | $0 |
| 2016 | $1,221 | $113,575 | $0 | $0 |
| 2015 | $1,291 | $113,575 | $0 | $0 |
| 2014 | $1,274 | $111,540 | $0 | $0 |
Source: Public Records
Map
Nearby Homes
Your Personal Tour Guide
Ask me questions while you tour the home.