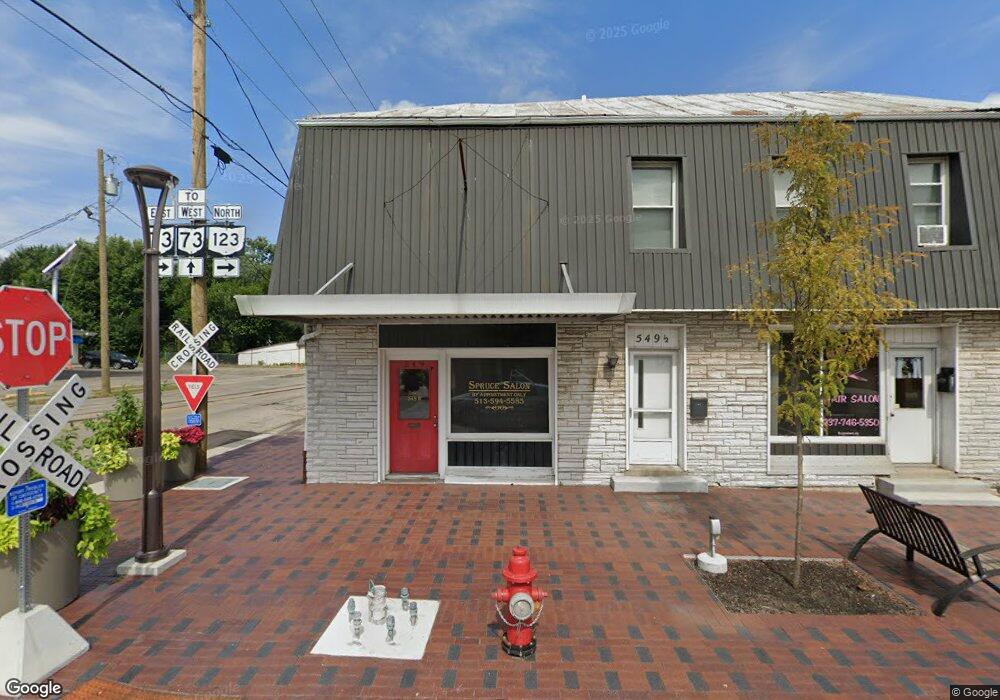
549 S Main St Franklin, OH 45005
Estimated Value: $172,336
--
Bed
--
Bath
858
Sq Ft
$201/Sq Ft
Est. Value
About This Home
This home is located at 549 S Main St, Franklin, OH 45005 and is currently estimated at $172,336, approximately $200 per square foot. 549 S Main St is a home located in Warren County with nearby schools including Franklin High School.
Ownership History
Date
Name
Owned For
Owner Type
Purchase Details
Closed on
Jul 6, 2019
Sold by
Centers Dennis D
Bought by
Centers Dennis D and Centers Joni Lea
Current Estimated Value
Purchase Details
Closed on
Apr 10, 2009
Sold by
Beecher Hill Inc
Bought by
Centers Dennis D
Purchase Details
Closed on
Jan 10, 2008
Sold by
Centers Dennis D and Centers Joni L
Bought by
Beecher Hill Inc
Home Financials for this Owner
Home Financials are based on the most recent Mortgage that was taken out on this home.
Original Mortgage
$153,000
Interest Rate
6.17%
Mortgage Type
Commercial
Purchase Details
Closed on
Jun 8, 2007
Sold by
Cook Kyle W and Cook Jeanette E
Bought by
Centers Dennis D
Create a Home Valuation Report for This Property
The Home Valuation Report is an in-depth analysis detailing your home's value as well as a comparison with similar homes in the area
Home Values in the Area
Average Home Value in this Area
Purchase History
| Date | Buyer | Sale Price | Title Company |
|---|---|---|---|
| Centers Dennis D | $1,000 | None Available | |
| Centers Dennis D | -- | Republic Title Agency | |
| Beecher Hill Inc | -- | Republic Title Agency | |
| Centers Dennis D | $80,000 | Republic Title Agency Inc |
Source: Public Records
Mortgage History
| Date | Status | Borrower | Loan Amount |
|---|---|---|---|
| Previous Owner | Beecher Hill Inc | $153,000 |
Source: Public Records
Tax History Compared to Growth
Tax History
| Year | Tax Paid | Tax Assessment Tax Assessment Total Assessment is a certain percentage of the fair market value that is determined by local assessors to be the total taxable value of land and additions on the property. | Land | Improvement |
|---|---|---|---|---|
| 2024 | $1,827 | $32,600 | $5,500 | $27,100 |
| 2023 | $1,835 | $29,641 | $5,001 | $24,640 |
| 2022 | $1,852 | $29,642 | $5,002 | $24,640 |
| 2021 | $1,777 | $29,642 | $5,002 | $24,640 |
| 2020 | $1,946 | $29,642 | $5,002 | $24,640 |
| 2019 | $1,797 | $29,642 | $5,002 | $24,640 |
| 2018 | $1,775 | $29,642 | $5,002 | $24,640 |
| 2017 | $1,831 | $29,642 | $5,002 | $24,640 |
| 2016 | $1,872 | $29,642 | $5,002 | $24,640 |
| 2015 | $935 | $29,642 | $5,002 | $24,640 |
| 2014 | $933 | $29,640 | $5,000 | $24,640 |
| 2013 | $1,605 | $29,640 | $5,000 | $24,640 |
Source: Public Records
Map
Nearby Homes