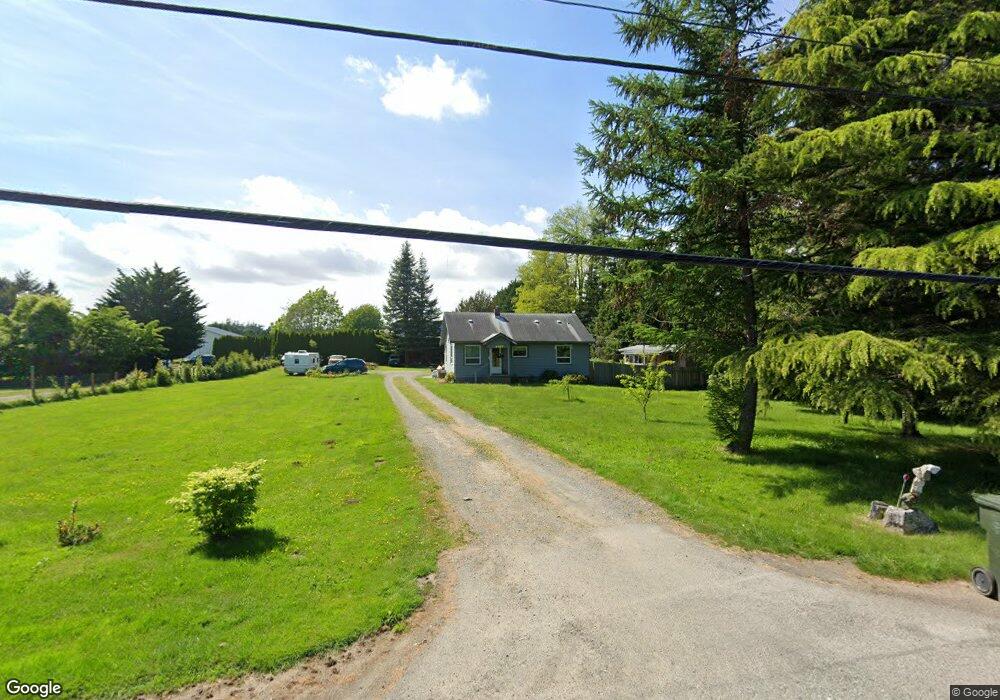
5497 Northwest Dr Bellingham, WA 98226
Estimated Value: $528,000 - $605,000
2
Beds
1
Bath
948
Sq Ft
$592/Sq Ft
Est. Value
About This Home
This home is located at 5497 Northwest Dr, Bellingham, WA 98226 and is currently estimated at $561,478, approximately $592 per square foot. 5497 Northwest Dr is a home located in Whatcom County with nearby schools including Cascadia Elementary School, Vista Middle School, and Ferndale High School.
Ownership History
Date
Name
Owned For
Owner Type
Purchase Details
Closed on
Feb 11, 2015
Sold by
Throop Genivieve and Couch Jason
Bought by
Molendyk Devon D and Molendyk Ashley N
Current Estimated Value
Home Financials for this Owner
Home Financials are based on the most recent Mortgage that was taken out on this home.
Original Mortgage
$219,489
Outstanding Balance
$167,489
Interest Rate
3.66%
Mortgage Type
New Conventional
Estimated Equity
$393,989
Purchase Details
Closed on
Mar 30, 2012
Sold by
Hsbc Bank Usa Na
Bought by
Throop Genivieve and Couch Jason
Purchase Details
Closed on
Nov 10, 2011
Sold by
Wilson Kellie
Bought by
Hsbc Bank Usa N A
Purchase Details
Closed on
Aug 11, 2006
Sold by
Evans Michelle and Evans Philip S
Bought by
Wilson Kellie
Home Financials for this Owner
Home Financials are based on the most recent Mortgage that was taken out on this home.
Original Mortgage
$260,000
Interest Rate
8.7%
Mortgage Type
Balloon
Create a Home Valuation Report for This Property
The Home Valuation Report is an in-depth analysis detailing your home's value as well as a comparison with similar homes in the area
Home Values in the Area
Average Home Value in this Area
Purchase History
| Date | Buyer | Sale Price | Title Company |
|---|---|---|---|
| Molendyk Devon D | $215,100 | First American Title | |
| Throop Genivieve | $150,199 | Stewart Title Company | |
| Hsbc Bank Usa N A | -- | None Available | |
| Wilson Kellie | $260,280 | Stewart Title Company |
Source: Public Records
Mortgage History
| Date | Status | Borrower | Loan Amount |
|---|---|---|---|
| Open | Molendyk Devon D | $219,489 | |
| Previous Owner | Wilson Kellie | $260,000 |
Source: Public Records
Tax History Compared to Growth
Tax History
| Year | Tax Paid | Tax Assessment Tax Assessment Total Assessment is a certain percentage of the fair market value that is determined by local assessors to be the total taxable value of land and additions on the property. | Land | Improvement |
|---|---|---|---|---|
| 2024 | $3,743 | $498,755 | $264,810 | $233,945 |
| 2023 | $3,743 | $524,947 | $300,000 | $224,947 |
| 2022 | $3,567 | $468,098 | $196,623 | $271,475 |
| 2021 | $3,600 | $386,857 | $162,498 | $224,359 |
| 2020 | $3,467 | $358,210 | $150,465 | $207,745 |
| 2019 | $2,766 | $311,991 | $131,051 | $180,940 |
| 2018 | $3,169 | $285,244 | $119,816 | $165,428 |
| 2017 | $2,340 | $249,972 | $105,000 | $144,972 |
| 2016 | $2,210 | $197,051 | $104,728 | $92,323 |
| 2015 | $2,223 | $185,795 | $99,152 | $86,643 |
| 2014 | -- | $181,846 | $96,900 | $84,946 |
| 2013 | -- | $179,022 | $95,000 | $84,022 |
Source: Public Records
Map
Nearby Homes
- 5502 Northwest Dr
- 0 W Axton Rd
- 1245 W Axton Rd
- 1396 Woods Point Loop
- 1371 W Axton Rd
- 1300 W Axton Rd
- 1378 W Smith Rd
- 794 W Smith Rd
- 5324 Shields Rd
- 5400 Barrett Rd
- 5330 Barret Rd S
- 5545 La Bounty Dr
- 1625 Main St Unit 11
- 5391 La Bounty Dr
- 5162 Spoonbill Ln
- 1655 Main St
- 5094 Labounty Rd
- 0 Labounty Unit 1968051
- 4958 Pacific Hwy
- 1474 Sunset Ave
- 5509 Northwest Dr
- 5485 Northwest Dr
- 1123 Lingbloom Rd
- 5492 Kent Dr
- 5515 Northwest Dr
- 1131 Lingbloom Rd
- 5484 Northwest Dr
- 5484 Northwest Dr
- 5484 Northwest Dr
- 5521 Northwest Dr
- 5488 Kent Dr
- 5469 Northwest Dr
- 5510 Northwest Dr
- 5504 Kent Dr
- 1137 Lingbloom Rd
- 5528 Northwest Dr
- 5528 Northwest Dr
- 1125 Pleasant Ln
- 5470 Northwest Dr
- 1145 Lingbloom Rd