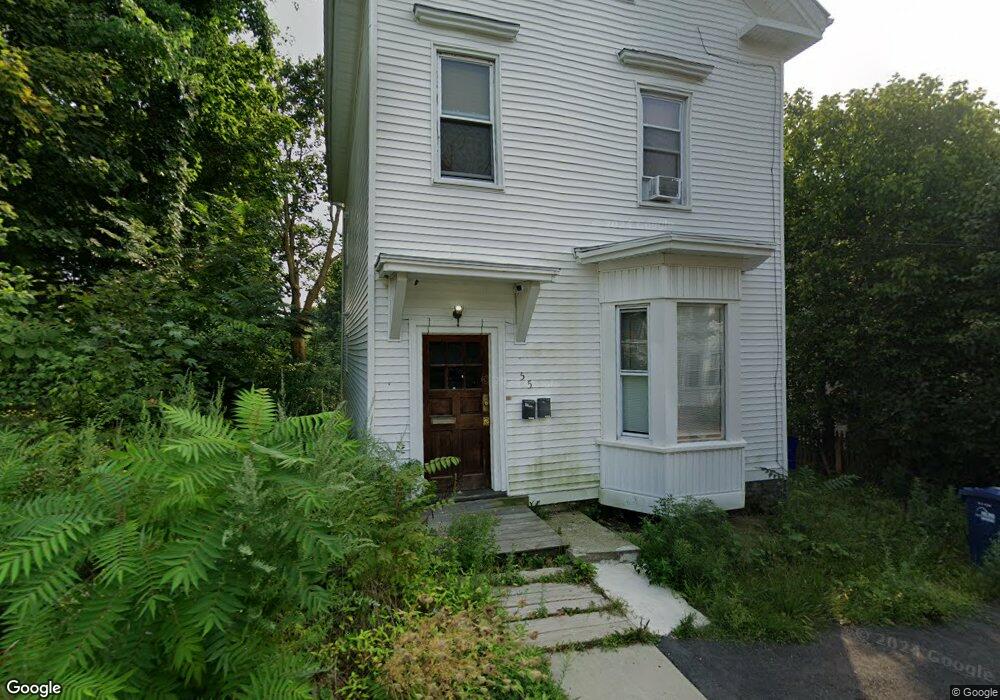
55 Alpine St Roxbury, MA 02119
Washington Park NeighborhoodEstimated Value: $601,000 - $617,000
7
Beds
2
Baths
1,918
Sq Ft
$316/Sq Ft
Est. Value
About This Home
This home is located at 55 Alpine St, Roxbury, MA 02119 and is currently estimated at $606,010, approximately $315 per square foot. 55 Alpine St is a home located in Suffolk County with nearby schools including Bridge Boston Charter School, Edward M. Kennedy Academy for Health Careers, and The Park School.
Ownership History
Date
Name
Owned For
Owner Type
Purchase Details
Closed on
Oct 31, 2025
Sold by
Nagasawa Mako and Nagasawa Ming
Bought by
Aska Jasmine
Current Estimated Value
Home Financials for this Owner
Home Financials are based on the most recent Mortgage that was taken out on this home.
Original Mortgage
$589,132
Outstanding Balance
$588,013
Interest Rate
6.26%
Mortgage Type
New Conventional
Estimated Equity
$17,997
Purchase Details
Closed on
Jun 30, 2022
Sold by
189 Grampian Way Llc
Bought by
Henderson Dwight D and Deck Shelby M
Home Financials for this Owner
Home Financials are based on the most recent Mortgage that was taken out on this home.
Original Mortgage
$960,000
Interest Rate
4%
Mortgage Type
Purchase Money Mortgage
Purchase Details
Closed on
Mar 10, 2021
Sold by
Southendext1 Llc
Bought by
Nagasawa Mako and Nagasawa Ming
Purchase Details
Closed on
Nov 22, 2013
Sold by
Dalin Multifamily Fund
Bought by
Southendext1 Llc
Home Financials for this Owner
Home Financials are based on the most recent Mortgage that was taken out on this home.
Original Mortgage
$320,000
Interest Rate
4.25%
Mortgage Type
New Conventional
Purchase Details
Closed on
Aug 7, 2009
Sold by
Berry Robert C and Chase Home Finance Llc
Bought by
Dalin Multi-Fmly Fund
Create a Home Valuation Report for This Property
The Home Valuation Report is an in-depth analysis detailing your home's value as well as a comparison with similar homes in the area
Home Values in the Area
Average Home Value in this Area
Purchase History
| Date | Buyer | Sale Price | Title Company |
|---|---|---|---|
| Aska Jasmine | $600,000 | -- | |
| Henderson Dwight D | $1,200,000 | None Available | |
| Nagasawa Mako | $635,000 | None Available | |
| Southendext1 Llc | $312,500 | -- | |
| Southendext1 Llc | $312,500 | -- | |
| Dalin Multi-Fmly Fund | $113,000 | -- | |
| Dalin Multi-Fmly Fund | $113,000 | -- |
Source: Public Records
Mortgage History
| Date | Status | Borrower | Loan Amount |
|---|---|---|---|
| Open | Aska Jasmine | $589,132 | |
| Previous Owner | Henderson Dwight D | $960,000 | |
| Previous Owner | Southendext1 Llc | $320,000 |
Source: Public Records
Tax History
| Year | Tax Paid | Tax Assessment Tax Assessment Total Assessment is a certain percentage of the fair market value that is determined by local assessors to be the total taxable value of land and additions on the property. | Land | Improvement |
|---|---|---|---|---|
| 2025 | $6,938 | $599,100 | $167,800 | $431,300 |
| 2024 | $6,071 | $557,000 | $142,600 | $414,400 |
| 2023 | $5,696 | $530,400 | $135,800 | $394,600 |
| 2022 | $6,016 | $552,900 | $123,500 | $429,400 |
| 2021 | $5,514 | $516,800 | $115,400 | $401,400 |
| 2020 | $4,878 | $461,900 | $106,900 | $355,000 |
| 2019 | $4,550 | $431,700 | $79,400 | $352,300 |
| 2018 | $4,230 | $403,600 | $79,400 | $324,200 |
| 2017 | $4,071 | $384,400 | $79,400 | $305,000 |
| 2016 | $3,775 | $343,200 | $79,400 | $263,800 |
| 2015 | $3,330 | $275,000 | $68,900 | $206,100 |
| 2014 | $2,662 | $211,600 | $68,900 | $142,700 |
Source: Public Records
Map
Nearby Homes
- 64 Alpine St Unit 104
- 64 Alpine St Unit 304
- 51 Saint James St
- 9 W Cedar St Unit 1
- 70 Rockland St
- 22 Rockville Park
- 20 Rockville Park
- 16 Hawthorne St
- 65 Lambert Ave
- 22-22A Montrose St
- 48-50 Dudley St
- 27 Dudley St
- 30 Copeland St Unit 1
- 8 Humboldt Ave Unit 2
- 150 Walnut Ave
- 156-160 Highland St Unit 156
- 91 Zeigler St
- 59 Copeland St
- 33 Copeland Park Unit CC
- 5 Valentine St Unit 1
- 55 Alpine St Unit 1
- 55 Alpine St Unit 2
- 49 Alpine St
- 49 Alpine St
- 49 Alpine St Unit 2
- 49 Alpine St
- 47 Alpine St
- 47 Alpine St
- 47 Alpine St Unit 2
- 47 Alpine St Unit 1
- 47 Alpine St Unit B
- 48 Alpine St
- 48 Alpine St Unit 1
- 48 Alpine St Unit 2
- 63 Alpine St
- 61 Alpine St
- 57 Regent St
- 49 Regent St
- 47 Regent St
- 47 Regent St Unit 1B
Your Personal Tour Guide
Ask me questions while you tour the home.