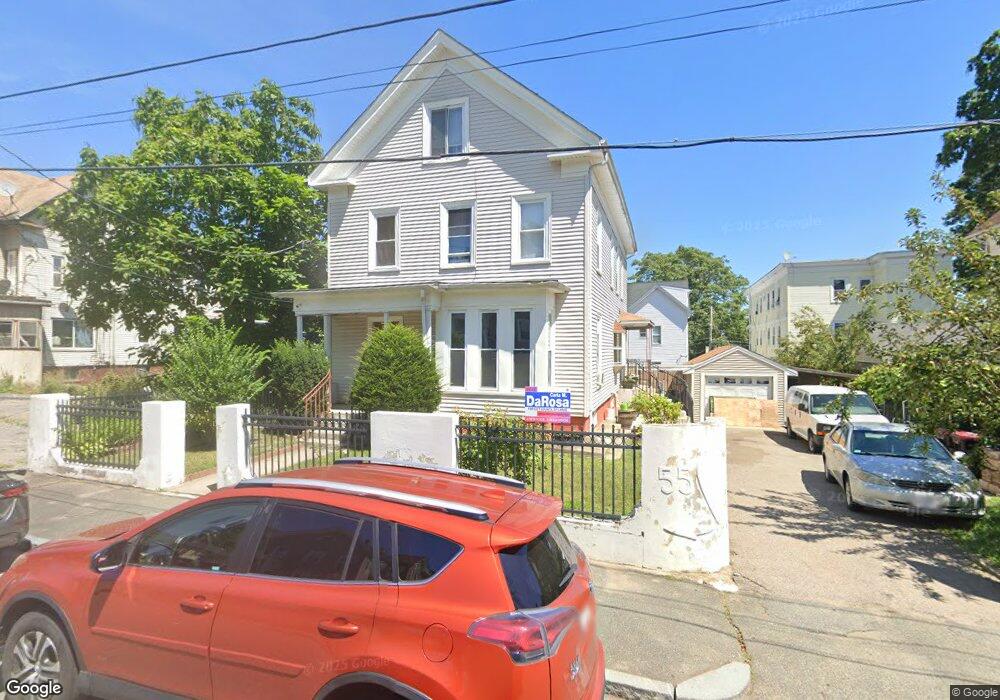
55 Appleton St Brockton, MA 02301
Estimated Value: $624,000 - $827,000
4
Beds
2
Baths
2,363
Sq Ft
$297/Sq Ft
Est. Value
About This Home
This home is located at 55 Appleton St, Brockton, MA 02301 and is currently estimated at $702,213, approximately $297 per square foot. 55 Appleton St is a home located in Plymouth County with nearby schools including Louis F Angelo Elementary School, Manthala George Jr. School, and Raymond K-8 Elementary School.
Ownership History
Date
Name
Owned For
Owner Type
Purchase Details
Closed on
Dec 7, 1999
Sold by
Pina Ramiro S
Bought by
Monteiro Maria T
Current Estimated Value
Purchase Details
Closed on
Sep 23, 1994
Sold by
Crescent Cu
Bought by
Pina Ramiro S
Purchase Details
Closed on
Jun 29, 1993
Sold by
Barros John M and Crescent Cu
Bought by
Crescent Cu
Create a Home Valuation Report for This Property
The Home Valuation Report is an in-depth analysis detailing your home's value as well as a comparison with similar homes in the area
Purchase History
| Date | Buyer | Sale Price | Title Company |
|---|---|---|---|
| Monteiro Maria T | $108,500 | -- | |
| Pina Ramiro S | $20,000 | -- | |
| Crescent Cu | $101,400 | -- |
Source: Public Records
Mortgage History
| Date | Status | Borrower | Loan Amount |
|---|---|---|---|
| Open | Crescent Cu | $220,000 | |
| Closed | Crescent Cu | $70,000 |
Source: Public Records
Tax History
| Year | Tax Paid | Tax Assessment Tax Assessment Total Assessment is a certain percentage of the fair market value that is determined by local assessors to be the total taxable value of land and additions on the property. | Land | Improvement |
|---|---|---|---|---|
| 2025 | $7,158 | $591,100 | $136,800 | $454,300 |
| 2024 | $6,746 | $561,200 | $136,800 | $424,400 |
| 2023 | $6,555 | $505,000 | $102,200 | $402,800 |
| 2022 | $6,463 | $462,600 | $92,800 | $369,800 |
| 2021 | $5,845 | $403,100 | $76,700 | $326,400 |
| 2020 | $4,987 | $329,200 | $72,300 | $256,900 |
| 2019 | $5,114 | $329,100 | $70,000 | $259,100 |
| 2018 | $4,808 | $299,400 | $70,000 | $229,400 |
| 2017 | $4,370 | $271,400 | $70,000 | $201,400 |
| 2016 | $3,908 | $225,100 | $67,800 | $157,300 |
| 2015 | $3,066 | $168,900 | $67,800 | $101,100 |
| 2014 | $3,068 | $169,200 | $67,800 | $101,400 |
Source: Public Records
Map
Nearby Homes
- 97 Huntington St
- 34 Cherry St
- 39 Huntington St
- 18 Walnut St
- 56 N Warren Ave
- 30 Elliot St
- 90 Cherry St
- 10 Fitzpatrick Ave
- 24 E Ashland St
- 85 Division St
- 7 Main St Unit 203
- 7 Main St Unit 102
- 14 Emmet St
- 527 N Warren Ave
- 45 Cross St
- 48 Simmons Ave
- 16 Olive St
- 146 Court St Unit 108
- 560 N Montello St
- 162 Warren Ave
- 55 Appleton St Unit 2
- 55 Appleton St Unit 1
- 49 Appleton St
- 61 Appleton St
- 92 Turner St
- 88 Turner St
- 100 Turner St
- 94 Turner St Unit 3R
- 45 Appleton St
- 52 Appleton St
- 52 Appleton St Unit 1
- 86 Turner St
- 66 Prospect St
- 58 Appleton St
- 46 Appleton St
- 46 Appleton St Unit 2
- 62 Appleton St
- 41 Appleton St
- 41 Appleton St Unit 1
- 74 Prospect St
Your Personal Tour Guide
Ask me questions while you tour the home.