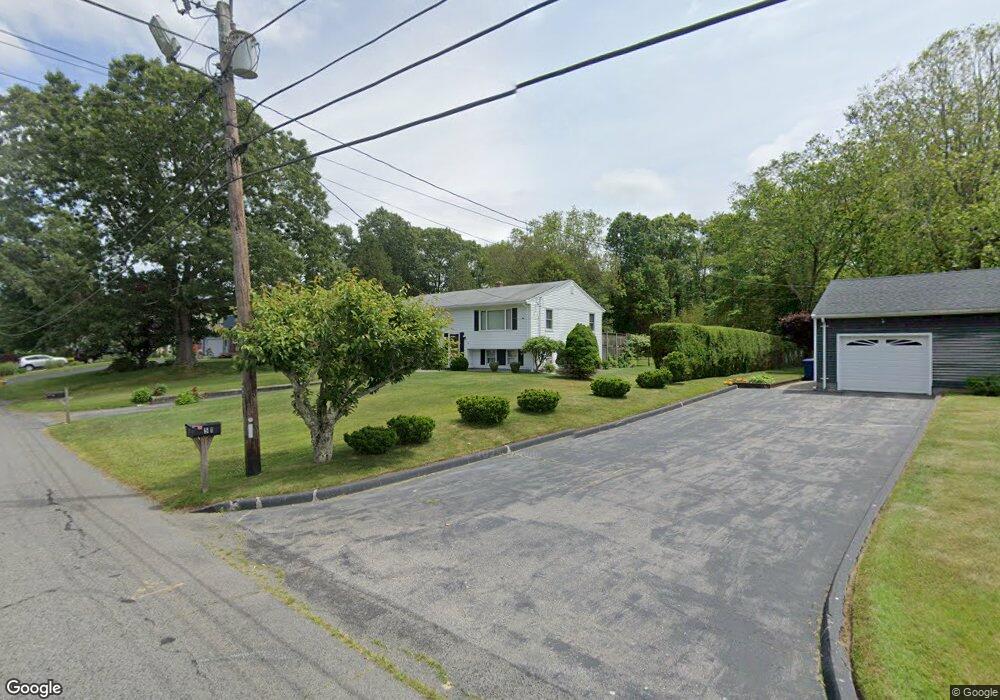
55 Benoit St Westport, MA 02790
North Westport NeighborhoodEstimated Value: $414,000 - $648,000
3
Beds
--
Bath
1,188
Sq Ft
$413/Sq Ft
Est. Value
About This Home
This home is located at 55 Benoit St, Westport, MA 02790 and is currently estimated at $490,088, approximately $412 per square foot. 55 Benoit St is a home located in Bristol County with nearby schools including Alice A. Macomber Primary School, Westport Elementary School, and Westport Middle-High School.
Ownership History
Date
Name
Owned For
Owner Type
Purchase Details
Closed on
May 11, 1988
Sold by
Viveiros Manuel
Bought by
Vicente Maria R
Current Estimated Value
Home Financials for this Owner
Home Financials are based on the most recent Mortgage that was taken out on this home.
Original Mortgage
$78,000
Interest Rate
10.02%
Mortgage Type
Purchase Money Mortgage
Create a Home Valuation Report for This Property
The Home Valuation Report is an in-depth analysis detailing your home's value as well as a comparison with similar homes in the area
Home Values in the Area
Average Home Value in this Area
Purchase History
| Date | Buyer | Sale Price | Title Company |
|---|---|---|---|
| Vicente Maria R | $123,000 | -- |
Source: Public Records
Mortgage History
| Date | Status | Borrower | Loan Amount |
|---|---|---|---|
| Closed | Vicente Maria R | $78,000 |
Source: Public Records
Tax History
| Year | Tax Paid | Tax Assessment Tax Assessment Total Assessment is a certain percentage of the fair market value that is determined by local assessors to be the total taxable value of land and additions on the property. | Land | Improvement |
|---|---|---|---|---|
| 2025 | $2,924 | $392,500 | $155,800 | $236,700 |
| 2024 | $2,920 | $377,800 | $144,300 | $233,500 |
| 2023 | $2,859 | $350,400 | $137,400 | $213,000 |
| 2022 | $2,846 | $335,600 | $137,400 | $198,200 |
| 2021 | $2,786 | $323,200 | $125,000 | $198,200 |
| 2020 | $2,450 | $290,600 | $120,000 | $170,600 |
| 2019 | $2,235 | $270,200 | $109,100 | $161,100 |
| 2018 | $2,150 | $263,100 | $110,200 | $152,900 |
| 2017 | $1,996 | $250,400 | $106,700 | $143,700 |
| 2016 | $1,869 | $236,300 | $103,200 | $133,100 |
| 2015 | $1,926 | $242,900 | $105,500 | $137,400 |
Source: Public Records
Map
Nearby Homes
Your Personal Tour Guide
Ask me questions while you tour the home.