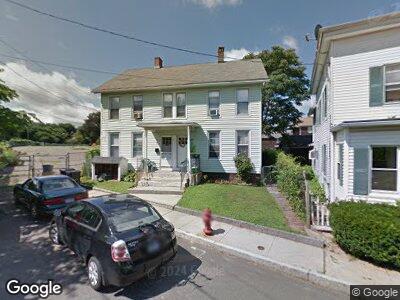
55 Bridge St Middletown, CT 06457
Estimated Value: $228,000 - $312,000
6
Beds
2
Baths
2,448
Sq Ft
$112/Sq Ft
Est. Value
About This Home
This home is located at 55 Bridge St, Middletown, CT 06457 and is currently estimated at $273,439, approximately $111 per square foot. 55 Bridge St is a home located in Middlesex County with nearby schools including Macdonough School, Middletown High School, and St John Paul II School.
Ownership History
Date
Name
Owned For
Owner Type
Purchase Details
Closed on
May 11, 2006
Sold by
Burelle Matthew and Molsberry Tania
Bought by
Smith Jonathan C and Sickel-Smith Amanda E
Current Estimated Value
Home Financials for this Owner
Home Financials are based on the most recent Mortgage that was taken out on this home.
Original Mortgage
$128,000
Interest Rate
8.25%
Purchase Details
Closed on
Aug 15, 2003
Sold by
Candelario Jesus M and Rosario Teresa R
Bought by
Burelle Matthew and Molsberry Tania
Home Financials for this Owner
Home Financials are based on the most recent Mortgage that was taken out on this home.
Original Mortgage
$105,300
Interest Rate
5.46%
Purchase Details
Closed on
Aug 17, 1999
Sold by
Silas David B and Silas Maryann
Bought by
Candelario Jesus M and Rosario Teresa R
Home Financials for this Owner
Home Financials are based on the most recent Mortgage that was taken out on this home.
Original Mortgage
$36,307
Interest Rate
7.65%
Create a Home Valuation Report for This Property
The Home Valuation Report is an in-depth analysis detailing your home's value as well as a comparison with similar homes in the area
Home Values in the Area
Average Home Value in this Area
Purchase History
| Date | Buyer | Sale Price | Title Company |
|---|---|---|---|
| Smith Jonathan C | $161,000 | -- | |
| Burelle Matthew | $117,000 | -- | |
| Candelario Jesus M | $48,410 | -- |
Source: Public Records
Mortgage History
| Date | Status | Borrower | Loan Amount |
|---|---|---|---|
| Open | Candelario Jesus M | $166,250 | |
| Closed | Candelario Jesus M | $128,000 | |
| Previous Owner | Candelario Jesus M | $105,300 | |
| Previous Owner | Candelario Jesus M | $36,307 | |
| Closed | Candelario Jesus M | $7,991 |
Source: Public Records
Tax History Compared to Growth
Tax History
| Year | Tax Paid | Tax Assessment Tax Assessment Total Assessment is a certain percentage of the fair market value that is determined by local assessors to be the total taxable value of land and additions on the property. | Land | Improvement |
|---|---|---|---|---|
| 2024 | $5,626 | $152,890 | $41,370 | $111,520 |
| 2023 | $5,366 | $152,890 | $41,370 | $111,520 |
| 2022 | $3,796 | $86,270 | $7,100 | $79,170 |
| 2021 | $3,796 | $86,270 | $7,100 | $79,170 |
| 2020 | $3,813 | $86,270 | $7,100 | $79,170 |
| 2019 | $3,860 | $86,270 | $7,100 | $79,170 |
| 2018 | $3,770 | $86,270 | $7,100 | $79,170 |
| 2017 | $4,515 | $106,490 | $23,810 | $82,680 |
| 2016 | $4,387 | $106,490 | $23,810 | $82,680 |
| 2015 | $4,217 | $106,490 | $23,810 | $82,680 |
| 2014 | $4,260 | $106,490 | $23,810 | $82,680 |
Source: Public Records
Map
Nearby Homes
- 21 Portland St
- 23 Portland St
- 35 Clinton Ave
- 50 Liberty St
- 233 Pearl St
- 17 Johnson St
- 27 Catherine St
- 80 Prospect St
- 175 Lincoln St
- 201 College St Unit 1
- 201 College St Unit 3
- 201 College St Unit 11
- 111 Dekoven Dr Unit 506
- 111 Dekoven Dr Unit 508
- 4 Commerce St
- 129 Newfield St
- 310 Newfield St
- 33 Waverly Ave
- 21 Tuccitto Rd
- 71 E Main St
- 55 Bridge St
- 59 Bridge St
- 7 Portland St
- 63 Bridge St
- 13 Portland St
- 19 Portland St
- 20 Portland St
- 14 Portland St
- 14 Portland St Unit 1
- 14 Portland St Unit 3
- 14 Portland St Unit 2
- 18 Portland St
- 20 Saint Johns St
- 20 St. Johns St
- 22 Saint Johns St
- 22 Portland St
- 30 Portland St
- 24 Saint Johns St
- 36 Saint Johns St
- 34 Saint Johns St