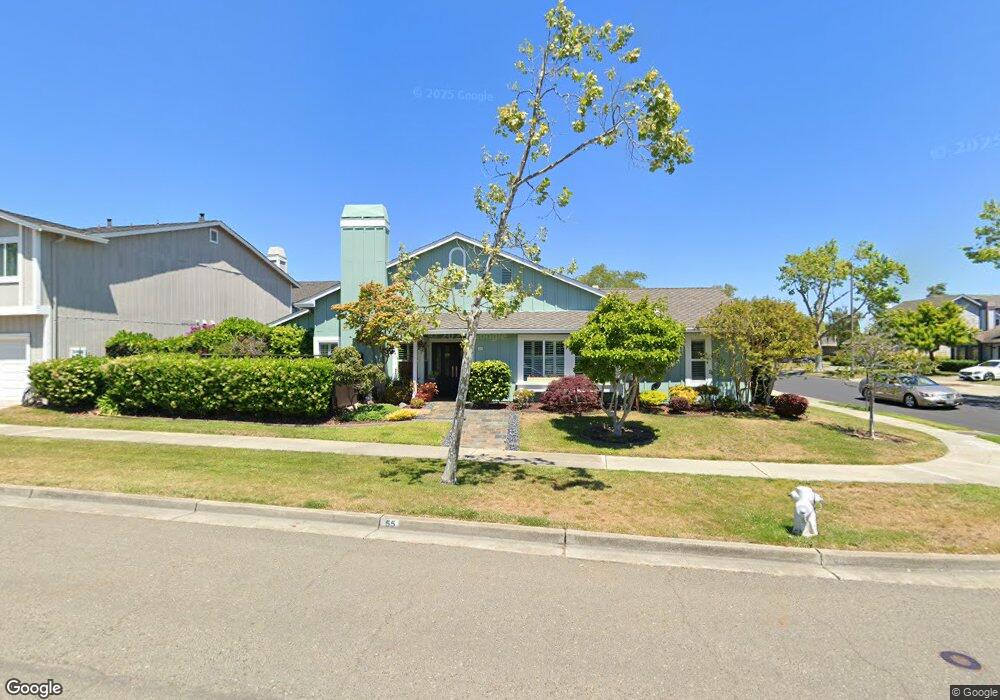
55 Captains Dr Alameda, CA 94502
Harbor Bay/Bay Farm NeighborhoodEstimated Value: $1,307,000 - $1,571,000
3
Beds
2
Baths
1,757
Sq Ft
$821/Sq Ft
Est. Value
About This Home
This home is located at 55 Captains Dr, Alameda, CA 94502 and is currently estimated at $1,442,511, approximately $821 per square foot. 55 Captains Dr is a home located in Alameda County with nearby schools including Amelia Earhart Elementary School, Lincoln Middle School, and Alameda High School.
Ownership History
Date
Name
Owned For
Owner Type
Purchase Details
Closed on
Dec 30, 2010
Sold by
Finkbeiner Hans and Finkbeiner Irene Alison
Bought by
Finkbeiner Hans and Finkbeiner Irene Alison
Current Estimated Value
Home Financials for this Owner
Home Financials are based on the most recent Mortgage that was taken out on this home.
Original Mortgage
$400,000
Outstanding Balance
$272,185
Interest Rate
4.74%
Mortgage Type
New Conventional
Estimated Equity
$1,170,326
Purchase Details
Closed on
Feb 11, 2009
Sold by
Finkbeiner Hans and Finkbeiner Irene Alison
Bought by
Finkbeiner Hans and Finkbeiner Irene Alison
Home Financials for this Owner
Home Financials are based on the most recent Mortgage that was taken out on this home.
Original Mortgage
$405,000
Interest Rate
4.92%
Mortgage Type
New Conventional
Purchase Details
Closed on
Aug 30, 1999
Sold by
Ronan Kevin M and Ronan Pam P
Bought by
Finkbeiner Hans and Finkbeiner Irene Alison
Create a Home Valuation Report for This Property
The Home Valuation Report is an in-depth analysis detailing your home's value as well as a comparison with similar homes in the area
Home Values in the Area
Average Home Value in this Area
Purchase History
| Date | Buyer | Sale Price | Title Company |
|---|---|---|---|
| Finkbeiner Hans | -- | Accommodation | |
| Finkbeiner Hans | -- | Fidelity National Title | |
| Finkbeiner Hans | -- | Old Republic Title Company | |
| Finkbeiner Hans | -- | Old Republic Title Company | |
| Finkbeiner Hans | $425,000 | Commonwealth Land Title |
Source: Public Records
Mortgage History
| Date | Status | Borrower | Loan Amount |
|---|---|---|---|
| Open | Finkbeiner Hans | $400,000 | |
| Closed | Finkbeiner Hans | $405,000 |
Source: Public Records
Tax History
| Year | Tax Paid | Tax Assessment Tax Assessment Total Assessment is a certain percentage of the fair market value that is determined by local assessors to be the total taxable value of land and additions on the property. | Land | Improvement |
|---|---|---|---|---|
| 2025 | $5,326 | $341,289 | $158,138 | $190,151 |
| 2024 | $5,326 | $334,461 | $155,038 | $186,423 |
| 2023 | $5,113 | $334,767 | $151,998 | $182,769 |
| 2022 | $4,985 | $321,203 | $149,018 | $179,185 |
| 2021 | $4,855 | $314,770 | $146,097 | $175,673 |
| 2020 | $4,787 | $318,473 | $144,600 | $173,873 |
| 2019 | $4,681 | $312,229 | $141,765 | $170,464 |
| 2018 | $4,396 | $306,108 | $138,986 | $167,122 |
| 2017 | $4,354 | $300,107 | $136,261 | $163,846 |
| 2016 | $4,342 | $294,224 | $133,590 | $160,634 |
| 2015 | $4,318 | $289,806 | $131,584 | $158,222 |
| 2014 | $4,080 | $284,128 | $129,006 | $155,122 |
Source: Public Records
Map
Nearby Homes
- 154 Basinside Way
- 622 Ironwood Rd
- 179 Oyster Pond Rd
- 30 Sea Bridge
- 1007 Via Aliso
- 1024 Fontana Dr
- 1037 Via Bonita
- 137 Parfait Ln
- 820 Island Dr
- 1130 Fontana Dr
- 2959 Sea View Pkwy
- 2857 Sea View Pkwy
- 3216 Belmont Way
- 57 Benedict Ct
- 405 Centre Ct
- 35 Britt Ct
- 3218 Fir Ave
- 632 Centre Ct Unit 48
- 608 Centre Ct
- 641 Centre Ct
- 207 Basinside Way
- 49 Captains Dr
- 394 Capetown Dr
- 215 Basinside Way
- 43 Captains Dr
- 52 Captains Dr
- 200 Basinside Way
- 206 Basinside Way
- 390 Capetown Dr
- 46 Captains Dr
- 212 Basinside Way
- 37 Captains Dr
- 184 Basinside Way
- 38 Captains Dr
- 218 Basinside Way
- 178 Basinside Way
- 384 Capetown Dr
- 165 Basinside Way
- 29 Captains Dr
- 408 Capetown Dr
Your Personal Tour Guide
Ask me questions while you tour the home.