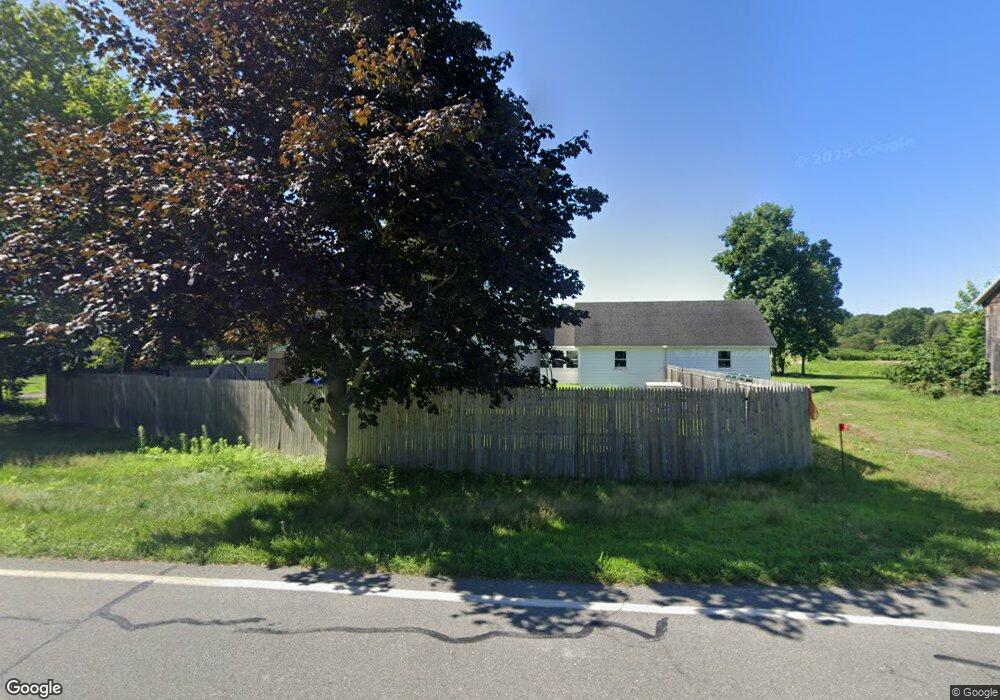
55 Depot Rd Hatfield, MA 01038
Estimated Value: $401,000 - $528,000
3
Beds
3
Baths
1,984
Sq Ft
$233/Sq Ft
Est. Value
About This Home
This home is located at 55 Depot Rd, Hatfield, MA 01038 and is currently estimated at $461,978, approximately $232 per square foot. 55 Depot Rd is a home located in Hampshire County with nearby schools including Hatfield Elementary School and Smith Academy.
Ownership History
Date
Name
Owned For
Owner Type
Purchase Details
Closed on
Jun 7, 2019
Sold by
Wroblewski John T and Wroblewski Edward W
Bought by
Herbert Stephen J and Herbert Michael A
Current Estimated Value
Home Financials for this Owner
Home Financials are based on the most recent Mortgage that was taken out on this home.
Original Mortgage
$278,000
Outstanding Balance
$241,868
Interest Rate
4%
Mortgage Type
New Conventional
Estimated Equity
$220,110
Create a Home Valuation Report for This Property
The Home Valuation Report is an in-depth analysis detailing your home's value as well as a comparison with similar homes in the area
Home Values in the Area
Average Home Value in this Area
Purchase History
| Date | Buyer | Sale Price | Title Company |
|---|---|---|---|
| Herbert Stephen J | $347,500 | -- |
Source: Public Records
Mortgage History
| Date | Status | Borrower | Loan Amount |
|---|---|---|---|
| Open | Herbert Stephen J | $278,000 |
Source: Public Records
Tax History
| Year | Tax Paid | Tax Assessment Tax Assessment Total Assessment is a certain percentage of the fair market value that is determined by local assessors to be the total taxable value of land and additions on the property. | Land | Improvement |
|---|---|---|---|---|
| 2025 | $5,471 | $395,300 | $157,700 | $237,600 |
| 2024 | $5,377 | $351,200 | $137,500 | $213,700 |
| 2023 | $4,481 | $332,400 | $130,700 | $201,700 |
| 2022 | $4,359 | $318,900 | $124,000 | $194,900 |
| 2021 | $4,172 | $294,000 | $112,700 | $181,300 |
| 2020 | $3,978 | $294,000 | $112,700 | $181,300 |
| 2019 | $3,939 | $283,551 | $115,751 | $167,800 |
| 2018 | $3,947 | $290,633 | $115,533 | $175,100 |
| 2017 | $3,775 | $285,565 | $114,865 | $170,700 |
| 2016 | $3,745 | $284,165 | $114,865 | $169,300 |
| 2015 | $3,496 | $265,465 | $103,565 | $161,900 |
| 2014 | $3,363 | $265,465 | $103,565 | $161,900 |
Source: Public Records
Map
Nearby Homes
- 59 N Hatfield Rd
- 0 Straits Rd
- 149 Prospect St
- 151 Pantry Rd
- 8 Aloha Dr
- 3 Frost Ln
- 71 Chestnut St
- 58 Main St Unit 4
- 58 Main St Unit 3
- 6 Shattuck Rd
- 18 Elm St
- Lot 3 Roosevelt St
- 14 Hawley Rd
- 15 S Plain Rd
- 7 Christian Ln
- 0 North St Unit 73407299
- 43 Laurel Park Unit 43
- 27 River Dr
- 208 Rolling Ridge Rd
- 11 West St
- 55 Depot Rd
- Lot 14.2 Cronin Hill Rd
- 1 Cronin Hill Rd
- 59 Depot Rd
- LOT 3 Woodridge Cir
- LOTS 77,78 West St
- LOT 6 The Jog
- LOT 2 Mountain Rd
- LOT 4 Mountain Rd
- TBD Old Stage Rd
- 2 Cronin Hill Rd
- 53 Depot Rd
- 3 Cronin Hill Rd
- 64 Depot Rd
- 0 Cronin Hill Rd Unit 72366815
- 0 Cronin Hill Rd Unit 72016553
- 0 Cronin Hill Rd Unit 72038824
- 0 Cronin Hill Rd Unit 71705290
- 5 Cronin Hill Rd
- 70 Depot Rd
Your Personal Tour Guide
Ask me questions while you tour the home.