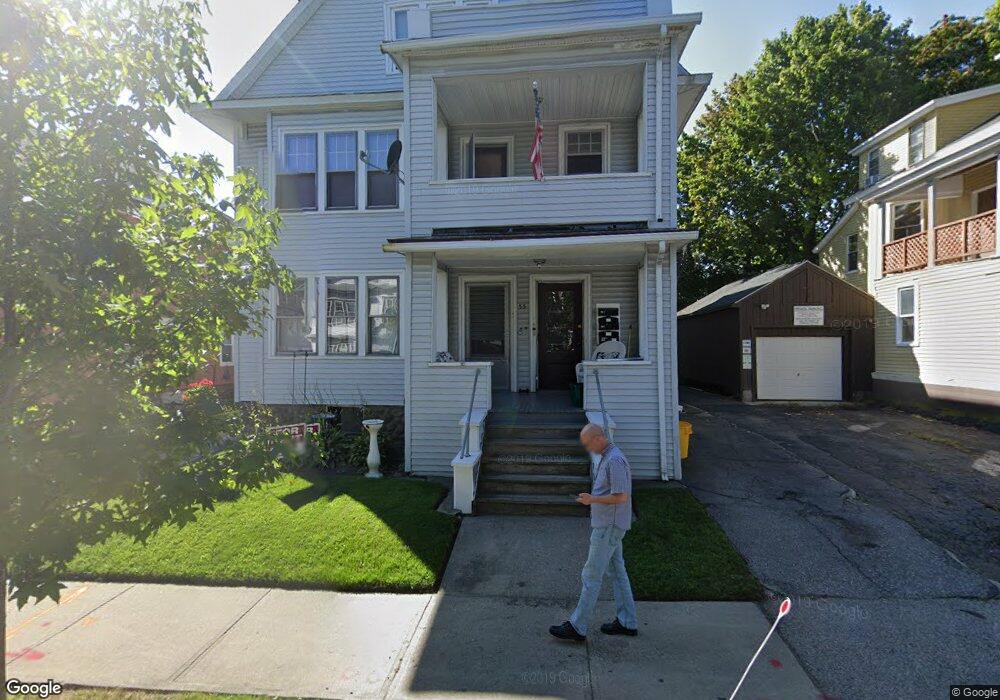
55 Dover St Worcester, MA 01609
Elm Park NeighborhoodEstimated Value: $440,964 - $832,000
8
Beds
3
Baths
4,341
Sq Ft
$151/Sq Ft
Est. Value
About This Home
This home is located at 55 Dover St, Worcester, MA 01609 and is currently estimated at $655,741, approximately $151 per square foot. 55 Dover St is a home located in Worcester County with nearby schools including Jacob Hiatt Magnet School, Chandler Magnet, and Elm Park Elementary School.
Ownership History
Date
Name
Owned For
Owner Type
Purchase Details
Closed on
Jul 8, 1997
Sold by
Est Morris Pearl H and Lukes Konstantina B
Bought by
Mullaney Mark S
Current Estimated Value
Home Financials for this Owner
Home Financials are based on the most recent Mortgage that was taken out on this home.
Original Mortgage
$67,925
Outstanding Balance
$10,046
Interest Rate
7.86%
Mortgage Type
Purchase Money Mortgage
Estimated Equity
$645,695
Create a Home Valuation Report for This Property
The Home Valuation Report is an in-depth analysis detailing your home's value as well as a comparison with similar homes in the area
Home Values in the Area
Average Home Value in this Area
Purchase History
| Date | Buyer | Sale Price | Title Company |
|---|---|---|---|
| Mullaney Mark S | $104,500 | -- |
Source: Public Records
Mortgage History
| Date | Status | Borrower | Loan Amount |
|---|---|---|---|
| Open | Mullaney Mark S | $67,925 |
Source: Public Records
Tax History
| Year | Tax Paid | Tax Assessment Tax Assessment Total Assessment is a certain percentage of the fair market value that is determined by local assessors to be the total taxable value of land and additions on the property. | Land | Improvement |
|---|---|---|---|---|
| 2025 | $6,330 | $479,900 | $83,700 | $396,200 |
| 2024 | $6,181 | $449,500 | $83,700 | $365,800 |
| 2023 | $5,729 | $399,500 | $72,800 | $326,700 |
| 2022 | $5,161 | $339,300 | $58,300 | $281,000 |
| 2021 | $4,786 | $294,000 | $46,600 | $247,400 |
| 2020 | $4,634 | $272,600 | $46,300 | $226,300 |
| 2019 | $4,801 | $266,700 | $40,400 | $226,300 |
| 2018 | $4,871 | $257,600 | $40,400 | $217,200 |
| 2017 | $4,611 | $239,900 | $40,400 | $199,500 |
| 2016 | $4,528 | $219,700 | $29,300 | $190,400 |
| 2015 | $4,409 | $219,700 | $29,300 | $190,400 |
| 2014 | $4,266 | $218,300 | $29,300 | $189,000 |
Source: Public Records
Map
Nearby Homes
- 9 Dover St
- 60 Fruit St
- 3 Marston Way
- 15 Goulding St
- 38 1/2 Bowdoin St
- 21 Fruit St
- 6 Pelham St
- 3 Suburban Rd
- 29 William St Unit 22
- 19 Highland Terrace
- 49 Metcalf St
- 59 Beechmont St
- 83 Newton Ave N
- 46 Townsend St
- 80 Salisbury St Unit 206
- 6 Newton Ave
- 93 Newton Ave N
- 56 Elm St Unit 2
- 13 West St
- 7 Longworth Rd
Your Personal Tour Guide
Ask me questions while you tour the home.