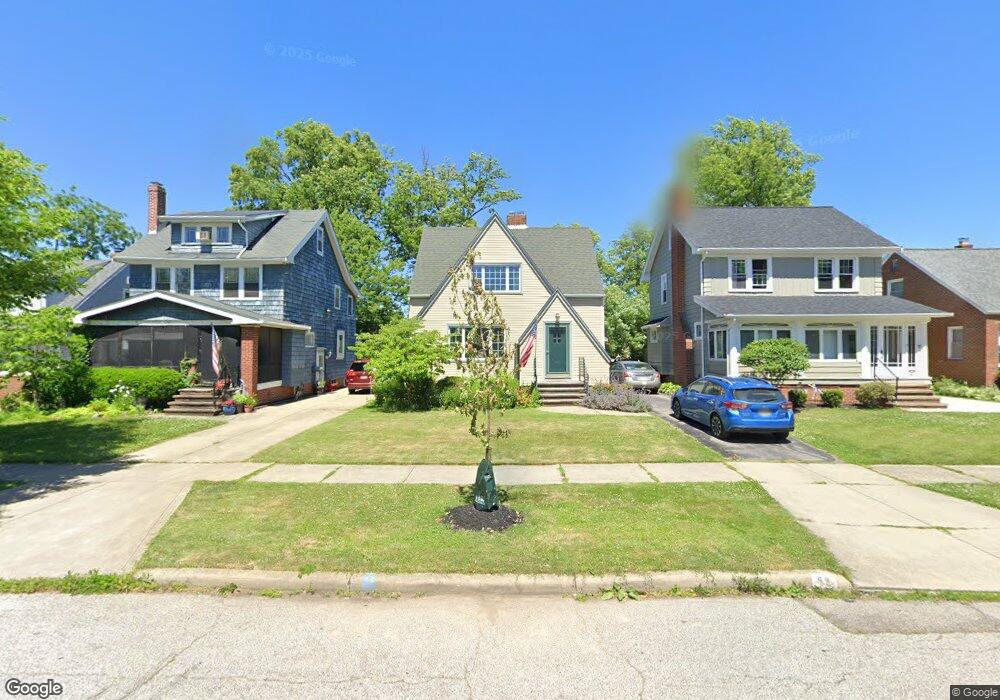
55 E 219th St Euclid, OH 44123
Estimated Value: $140,588 - $189,000
2
Beds
1
Bath
1,136
Sq Ft
$140/Sq Ft
Est. Value
About This Home
This home is located at 55 E 219th St, Euclid, OH 44123 and is currently estimated at $159,147, approximately $140 per square foot. 55 E 219th St is a home located in Cuyahoga County with nearby schools including Bluestone Elementary School, Euclid High School, and Pinnacle Academy.
Ownership History
Date
Name
Owned For
Owner Type
Purchase Details
Closed on
Mar 13, 2002
Sold by
Jones Donna J and Peppard Donna J
Bought by
Peppard James P
Current Estimated Value
Purchase Details
Closed on
Apr 8, 1999
Sold by
Peppard James P and Peppard Donna J
Bought by
Peppard James P and Peppard Donna J
Purchase Details
Closed on
Feb 16, 1999
Sold by
Vinborg Brian H
Bought by
Peppard James P and Peppard Donna J
Purchase Details
Closed on
Aug 27, 1990
Sold by
Duke Karen A
Bought by
Vinborg Brian H
Purchase Details
Closed on
Apr 1, 1987
Sold by
Ban John J
Bought by
Duke Karen A
Purchase Details
Closed on
Jul 22, 1986
Sold by
Bann John J
Bought by
Ban John J
Purchase Details
Closed on
Mar 28, 1977
Sold by
Bann John J and Bann Mary
Bought by
Bann John J
Purchase Details
Closed on
Jan 1, 1975
Bought by
Bann John J and Bann Mary
Create a Home Valuation Report for This Property
The Home Valuation Report is an in-depth analysis detailing your home's value as well as a comparison with similar homes in the area
Home Values in the Area
Average Home Value in this Area
Purchase History
| Date | Buyer | Sale Price | Title Company |
|---|---|---|---|
| Peppard James P | -- | -- | |
| Peppard James P | -- | -- | |
| Peppard James P | $96,000 | Chicago Title Insurance Comp | |
| Vinborg Brian H | $71,500 | -- | |
| Duke Karen A | $50,000 | -- | |
| Ban John J | -- | -- | |
| Bann John J | -- | -- | |
| Bann John J | -- | -- |
Source: Public Records
Tax History
| Year | Tax Paid | Tax Assessment Tax Assessment Total Assessment is a certain percentage of the fair market value that is determined by local assessors to be the total taxable value of land and additions on the property. | Land | Improvement |
|---|---|---|---|---|
| 2024 | $2,544 | $46,060 | $11,095 | $34,965 |
| 2023 | $2,484 | $37,490 | $9,170 | $28,320 |
| 2022 | $2,462 | $37,490 | $9,170 | $28,320 |
| 2021 | $2,740 | $37,490 | $9,170 | $28,320 |
| 2020 | $2,718 | $34,720 | $8,510 | $26,220 |
| 2019 | $2,444 | $99,200 | $24,300 | $74,900 |
| 2018 | $2,465 | $34,720 | $8,510 | $26,220 |
| 2017 | $2,438 | $30,140 | $7,250 | $22,890 |
| 2016 | $2,443 | $30,140 | $7,250 | $22,890 |
| 2015 | $2,226 | $30,140 | $7,250 | $22,890 |
| 2014 | $2,226 | $30,140 | $7,250 | $22,890 |
Source: Public Records
Map
Nearby Homes
- 104 E 219th St
- 170 E 220th St
- 226 E 216th St
- 55 Sunnycliff Dr
- 336 E 222nd St
- 285 E 216th St
- 144 E 208th St
- 324 E 215th St
- 461 Kenwood Dr Unit T3
- 421 Kenwood Dr Unit G
- 450 Kenwood Dr Unit D-12
- 450 Kenwood Dr Unit E12
- 308 Buckner Dr Unit 204
- 422 Clearview Dr Unit J10
- 273 E 208th St
- 22751 Fox Ave
- 20470 Lake Shore Blvd
- 521 Kenwood Dr Unit B-5
- 324 E 235th St
- 23298 Williams Ave
Your Personal Tour Guide
Ask me questions while you tour the home.