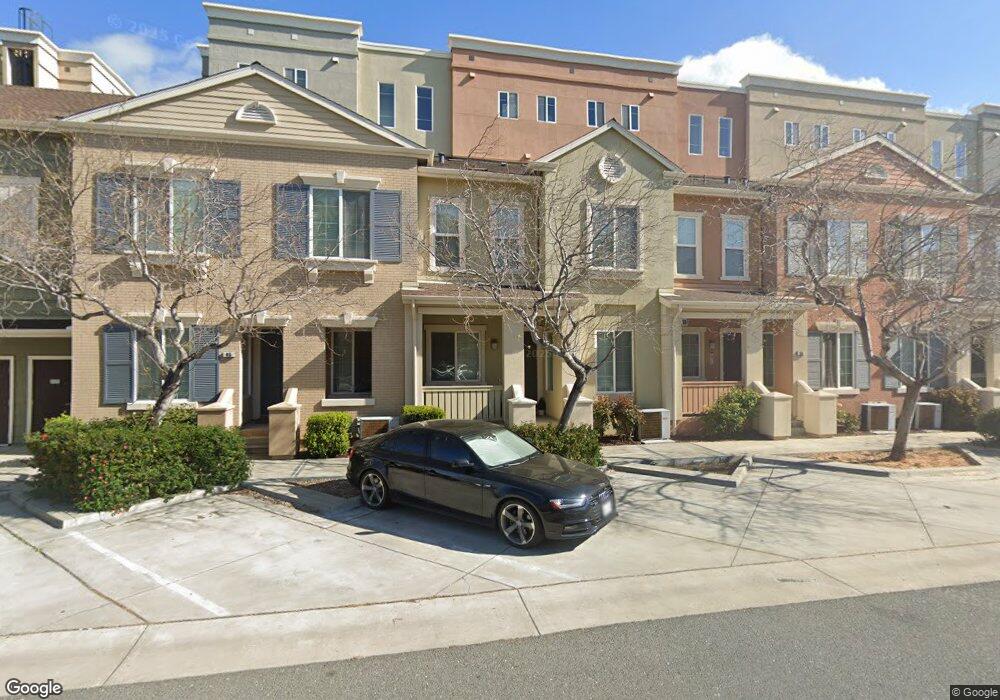
55 E 7th St Pittsburg, CA 94565
Downtown Pittsburg NeighborhoodEstimated Value: $417,000 - $471,000
2
Beds
3
Baths
1,217
Sq Ft
$362/Sq Ft
Est. Value
About This Home
This home is located at 55 E 7th St, Pittsburg, CA 94565 and is currently estimated at $440,864, approximately $362 per square foot. 55 E 7th St is a home located in Contra Costa County with nearby schools including Marina Vista Elementary School, Martin Luther King Jr. Junior High School, and Pittsburg Senior High School.
Ownership History
Date
Name
Owned For
Owner Type
Purchase Details
Closed on
Mar 16, 2020
Sold by
Johnson Richard
Bought by
Hager Maria
Current Estimated Value
Home Financials for this Owner
Home Financials are based on the most recent Mortgage that was taken out on this home.
Original Mortgage
$358,388
Outstanding Balance
$316,798
Interest Rate
3.4%
Mortgage Type
FHA
Estimated Equity
$124,066
Purchase Details
Closed on
May 9, 2017
Sold by
Johnson Sharlene
Bought by
Johnson Richard
Purchase Details
Closed on
May 8, 2017
Sold by
Traverso Tara and Stokes Tara
Bought by
Johnson Richard
Purchase Details
Closed on
Nov 8, 2010
Sold by
Redevelopment Agency Of The City Of Pitt
Bought by
Stokes Tara
Home Financials for this Owner
Home Financials are based on the most recent Mortgage that was taken out on this home.
Original Mortgage
$154,704
Interest Rate
4.18%
Mortgage Type
FHA
Create a Home Valuation Report for This Property
The Home Valuation Report is an in-depth analysis detailing your home's value as well as a comparison with similar homes in the area
Home Values in the Area
Average Home Value in this Area
Purchase History
| Date | Buyer | Sale Price | Title Company |
|---|---|---|---|
| Hager Maria | $365,000 | Fidelity National Title Co | |
| Johnson Richard | -- | Old Republic Title Company | |
| Traverso Tara | -- | Old Republic Title Company | |
| Johnson Richard | $290,000 | Old Republic Title Company | |
| Stokes Tara | $157,000 | First American Title Company |
Source: Public Records
Mortgage History
| Date | Status | Borrower | Loan Amount |
|---|---|---|---|
| Open | Hager Maria | $358,388 | |
| Previous Owner | Stokes Tara | $154,704 |
Source: Public Records
Tax History
| Year | Tax Paid | Tax Assessment Tax Assessment Total Assessment is a certain percentage of the fair market value that is determined by local assessors to be the total taxable value of land and additions on the property. | Land | Improvement |
|---|---|---|---|---|
| 2025 | $6,210 | $399,175 | $174,981 | $224,194 |
| 2024 | $5,890 | $391,349 | $171,550 | $219,799 |
| 2023 | $5,890 | $383,677 | $168,187 | $215,490 |
| 2022 | $5,924 | $376,155 | $164,890 | $211,265 |
| 2021 | $5,888 | $368,780 | $161,657 | $207,123 |
| 2019 | $4,919 | $301,716 | $72,828 | $228,888 |
| 2018 | $4,727 | $295,800 | $71,400 | $224,400 |
| 2017 | $3,290 | $172,979 | $27,597 | $145,382 |
| 2016 | $3,051 | $169,588 | $27,056 | $142,532 |
| 2015 | $3,145 | $167,042 | $26,650 | $140,392 |
| 2014 | $3,035 | $163,770 | $26,128 | $137,642 |
Source: Public Records
Map
Nearby Homes
- 88 E 6th St Unit 215
- 118 Pelican Loop
- 251 Shoreline Dr
- 115 Pelican Loop
- 311 Shoreline Dr
- 430 E 8th St
- 80 Loma Vista Way
- 65 Edgewater Place
- 301 Central Ave
- 310 Central Ave
- 175 Halsey Way
- 246 Mindy Way
- Baxter Plan at Liberty II
- Aubrey Plan at Liberty II
- 231 Mindy Way
- 158 E 15th St
- 532 Central Ave
- 251 E 17th St
- 815 Central Ave
- 585 School St
- 55 E 7th St Unit 104
- 65 E 7th St
- 45 E 7th St
- 75 E 7th St Unit 102
- 85 E 7th St
- 35 E 7th St Unit 106
- 35 E 7th St
- 95 E 7th St
- 25 E 7th St
- 633 Black Diamond St
- 623 Black Diamond St Unit 110
- 613 Black Diamond St Unit 111
- 38 E 6th St
- 48 E 6th St Unit 116
- 58 E 6th St
- 28 E 6th St Unit 114
- 18 E 6th St
- 615 Black Diamond St Unit 112
- 10 W 7th St
- 668 Black Diamond St
Your Personal Tour Guide
Ask me questions while you tour the home.