55 Ferncrest Ave Coventry, RI 02816
Estimated Value: $381,000 - $488,000
2
Beds
1
Bath
1,648
Sq Ft
$258/Sq Ft
Est. Value
About This Home
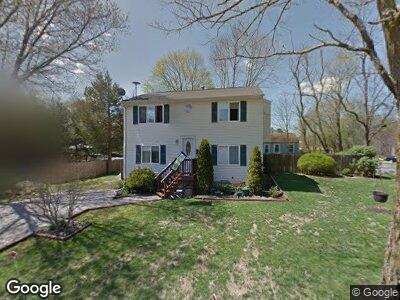
This home is located at 55 Ferncrest Ave, Coventry, RI 02816 and is currently estimated at $424,405, approximately $257 per square foot. 55 Ferncrest Ave is a home located in Kent County with nearby schools including Alan Shawn Feinstein Ms Of Cov, Coventry High School, and Father John V. Doyle School.
Ownership History
Date
Name
Owned For
Owner Type
Purchase Details
Closed on
Oct 3, 2016
Sold by
Johnson Claudia S and Russo Brian A
Bought by
Johnson Claudia S
Current Estimated Value
Home Financials for this Owner
Home Financials are based on the most recent Mortgage that was taken out on this home.
Original Mortgage
$184,000
Outstanding Balance
$121,462
Interest Rate
3.42%
Mortgage Type
Stand Alone Refi Refinance Of Original Loan
Purchase Details
Closed on
Apr 13, 2016
Sold by
Johnson Claudia S and Russo Brian A
Bought by
Johnson Claudia S
Purchase Details
Closed on
Nov 16, 2010
Sold by
Johnsonj Claudia S and Russo Brian A
Bought by
Johnson Claudia S
Purchase Details
Closed on
Jul 7, 2000
Sold by
Behm Brent R and Behm Debra L
Bought by
Johnson Jeffrey A and Johnson Claudia S
Purchase Details
Closed on
Feb 3, 1997
Sold by
Fooks Patricia L
Bought by
Behm Bent R and Behm Debra
Create a Home Valuation Report for This Property
The Home Valuation Report is an in-depth analysis detailing your home's value as well as a comparison with similar homes in the area
Home Values in the Area
Average Home Value in this Area
Purchase History
| Date | Buyer | Sale Price | Title Company |
|---|---|---|---|
| Johnson Claudia S | -- | -- | |
| Johnson Claudia S | -- | -- | |
| Johnson Claudia S | -- | -- | |
| Johnson Jeffrey A | $98,500 | -- | |
| Behm Bent R | $80,000 | -- |
Source: Public Records
Mortgage History
| Date | Status | Borrower | Loan Amount |
|---|---|---|---|
| Open | Behm Bent R | $184,000 | |
| Previous Owner | Behm Bent R | $220,000 |
Source: Public Records
Tax History Compared to Growth
Tax History
| Year | Tax Paid | Tax Assessment Tax Assessment Total Assessment is a certain percentage of the fair market value that is determined by local assessors to be the total taxable value of land and additions on the property. | Land | Improvement |
|---|---|---|---|---|
| 2024 | $5,203 | $328,500 | $91,800 | $236,700 |
| 2023 | $5,036 | $328,500 | $91,800 | $236,700 |
| 2022 | $5,151 | $263,200 | $85,200 | $178,000 |
| 2021 | $5,106 | $263,200 | $85,200 | $178,000 |
| 2020 | $5,854 | $263,200 | $85,200 | $178,000 |
| 2019 | $5,011 | $225,300 | $66,600 | $158,700 |
| 2018 | $4,869 | $225,300 | $66,600 | $158,700 |
| 2017 | $4,727 | $225,300 | $66,600 | $158,700 |
| 2016 | $4,485 | $209,500 | $54,300 | $155,200 |
| 2015 | $4,364 | $209,500 | $54,300 | $155,200 |
| 2014 | $4,273 | $209,500 | $54,300 | $155,200 |
| 2013 | $4,070 | $218,100 | $71,800 | $146,300 |
Source: Public Records
Map
Nearby Homes
- 55 Ferncrest Ave
- 25 Parker St
- 47 Ferncrest Ave
- 41 Parker St
- 30 Parker St
- 21 Parker St
- 38 Parker St Unit 40
- 0 Parker St Unit 1030792
- 0 Parker St Unit 1077262
- 0 Parker St Unit 1234551
- 0 Parker St
- 17 Parker St
- 3 Harding St
- 31 Ferncrest Ave
- 23 Ferncrest Ave
- 13 Parker St
- 19 Ferncrest Ave
- 5 Harding St
- 13 Harding St
- 17 Ferncrest Ave