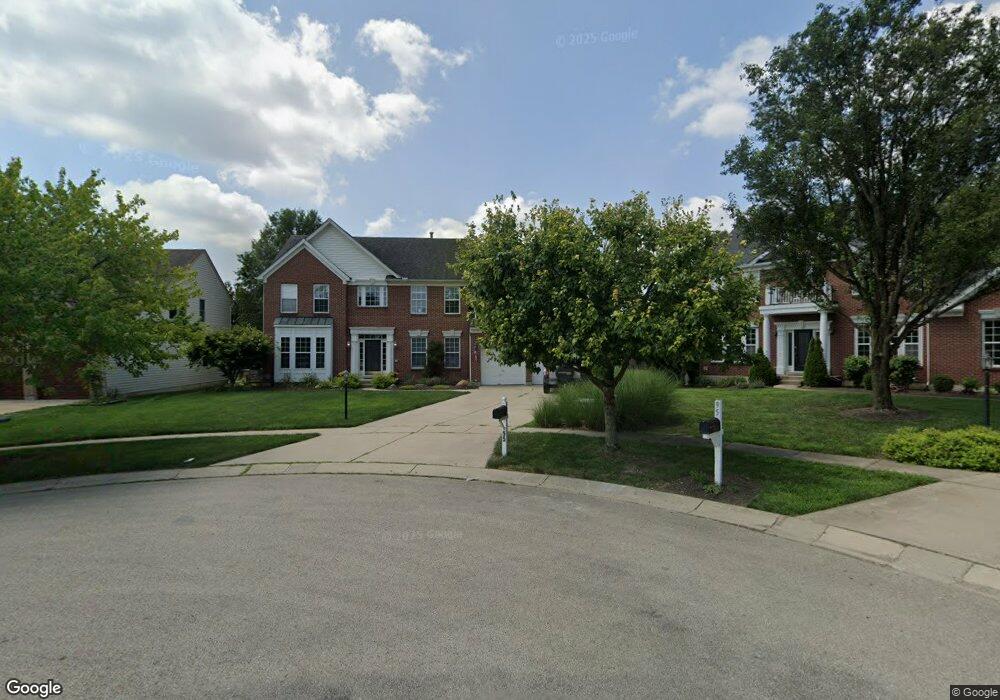
55 Gregg Ct Springboro, OH 45066
Estimated Value: $526,778 - $593,000
4
Beds
3
Baths
3,362
Sq Ft
$166/Sq Ft
Est. Value
About This Home
This home is located at 55 Gregg Ct, Springboro, OH 45066 and is currently estimated at $559,445, approximately $166 per square foot. 55 Gregg Ct is a home located in Warren County with nearby schools including Clearcreek Elementary School, Springboro Intermediate School, and Springboro Junior High School.
Ownership History
Date
Name
Owned For
Owner Type
Purchase Details
Closed on
Nov 15, 2019
Sold by
Price Kenneth D and Price Michelle A
Bought by
Price Kenneth D and Price Michelle A
Current Estimated Value
Purchase Details
Closed on
Jan 10, 2019
Sold by
Lahuis David
Bought by
Price Michelle and Price Kenneth
Purchase Details
Closed on
May 21, 2010
Sold by
Haley John D and Haley Martha W
Bought by
Lahuis David and Lahuis Michelle
Home Financials for this Owner
Home Financials are based on the most recent Mortgage that was taken out on this home.
Original Mortgage
$208,000
Outstanding Balance
$137,737
Interest Rate
5.12%
Mortgage Type
New Conventional
Estimated Equity
$421,708
Purchase Details
Closed on
Apr 4, 2002
Sold by
Cor Cendant Mobility Fin
Bought by
Cendant Mobility Fin Corp
Home Financials for this Owner
Home Financials are based on the most recent Mortgage that was taken out on this home.
Original Mortgage
$125,000
Interest Rate
6.87%
Mortgage Type
Balloon
Purchase Details
Closed on
Jan 15, 1998
Sold by
Coffmann Dev Co
Bought by
Zaring Homes Inc
Create a Home Valuation Report for This Property
The Home Valuation Report is an in-depth analysis detailing your home's value as well as a comparison with similar homes in the area
Home Values in the Area
Average Home Value in this Area
Purchase History
| Date | Buyer | Sale Price | Title Company |
|---|---|---|---|
| Price Kenneth D | -- | None Available | |
| Price Michelle | -- | Landmark Title Agency South | |
| Lahuis David | -- | Landmark Title Agency S Inc | |
| Cendant Mobility Fin Corp | $257,000 | -- | |
| Zaring Homes Inc | $343,200 | -- |
Source: Public Records
Mortgage History
| Date | Status | Borrower | Loan Amount |
|---|---|---|---|
| Open | Lahuis David | $208,000 | |
| Previous Owner | Cendant Mobility Fin Corp | $125,000 |
Source: Public Records
Tax History
| Year | Tax Paid | Tax Assessment Tax Assessment Total Assessment is a certain percentage of the fair market value that is determined by local assessors to be the total taxable value of land and additions on the property. | Land | Improvement |
|---|---|---|---|---|
| 2025 | $6,300 | $161,330 | $38,500 | $122,830 |
| 2024 | $6,300 | $161,330 | $38,500 | $122,830 |
| 2023 | $5,327 | $125,090 | $20,650 | $104,440 |
| 2022 | $5,248 | $125,090 | $20,650 | $104,440 |
| 2021 | $4,884 | $125,090 | $20,650 | $104,440 |
| 2020 | $4,735 | $106,008 | $17,500 | $88,508 |
| 2019 | $4,235 | $102,855 | $17,500 | $85,355 |
| 2018 | $3,878 | $102,855 | $17,500 | $85,355 |
| 2017 | $3,852 | $92,950 | $16,079 | $76,871 |
| 2016 | $4,018 | $92,950 | $16,079 | $76,871 |
| 2015 | $4,026 | $92,950 | $16,079 | $76,871 |
| 2014 | $3,824 | $84,500 | $14,620 | $69,880 |
| 2013 | $3,821 | $101,170 | $17,500 | $83,670 |
Source: Public Records
Map
Nearby Homes
- 80 Gregg Ct
- 25 Glass Ct
- 250 Ballard Dr
- 33 Christman Dr
- 92 Villa Pointe Dr Unit 92
- 195 Oasis Ct
- 365 Crockett Dr
- 10084 Gully Pass Dr Unit 248
- 10084 Gully Pass Dr
- 25 Blose Ct
- 10109 Gully Pass Dr Unit 250
- 123 Rippling Brook Ln
- 1315 Woodland Greens Blvd
- 10213 Gully Pass Dr Unit 251
- 2002 Glen Valley Dr
- 182 Rippling Brook Ln
- 136 Waterhaven Way
- 10152 Gully Pass Dr
- 160 Old Pond Rd
- 135 Winding Creek Dr
Your Personal Tour Guide
Ask me questions while you tour the home.