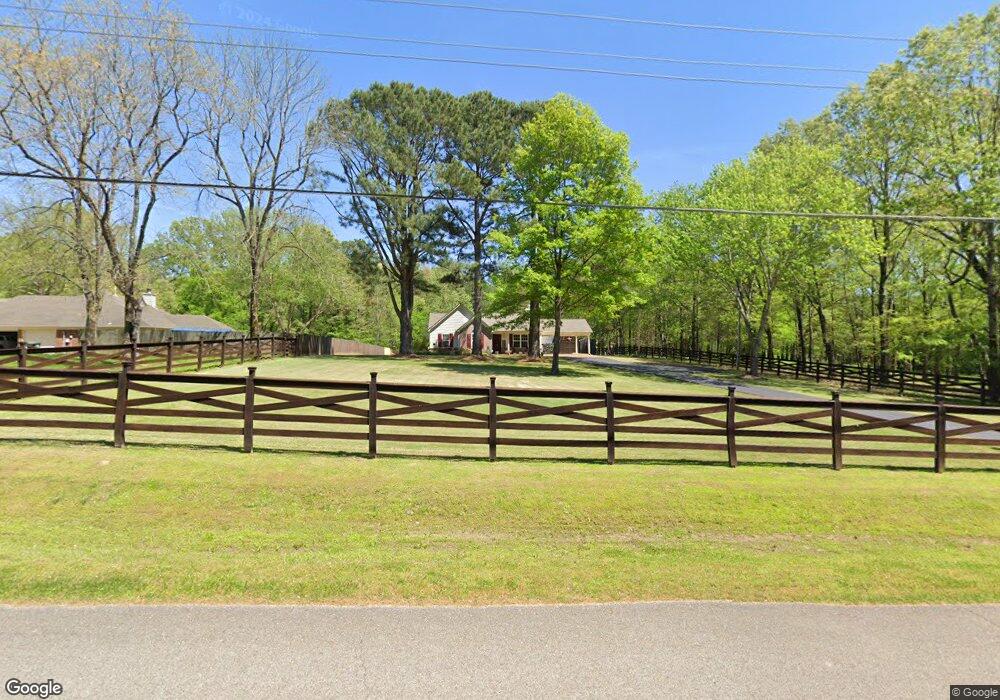
55 Grove Rd Collierville, TN 38017
Estimated Value: $203,421 - $263,000
Studio
2
Baths
1,188
Sq Ft
$202/Sq Ft
Est. Value
About This Home
This home is located at 55 Grove Rd, Collierville, TN 38017 and is currently estimated at $240,355, approximately $202 per square foot. 55 Grove Rd is a home located in Fayette County with nearby schools including Southwest Elementary School, West Junior High School, and Fayette Ware Comprehensive High School.
Ownership History
Date
Name
Owned For
Owner Type
Purchase Details
Closed on
Feb 13, 2020
Sold by
Beasley Amy P
Bought by
Beasley Amy P and Beasley John A
Current Estimated Value
Home Financials for this Owner
Home Financials are based on the most recent Mortgage that was taken out on this home.
Original Mortgage
$146,520
Outstanding Balance
$130,101
Interest Rate
3.75%
Mortgage Type
FHA
Estimated Equity
$110,254
Purchase Details
Closed on
Jan 3, 2002
Sold by
Argo Homes
Bought by
Ollar Troy A
Purchase Details
Closed on
Dec 3, 2001
Sold by
Argo Homes
Bought by
Beasley Amy P
Purchase Details
Closed on
Aug 23, 2001
Sold by
Kelly Donna Marie
Bought by
Argo Homes Inc
Purchase Details
Closed on
Aug 15, 2001
Sold by
Kelly Donna Marie
Bought by
Argo Homes Inc
Purchase Details
Closed on
Jul 26, 1989
Bought by
Kelly Donna Marie
Purchase Details
Closed on
Sep 26, 1988
Create a Home Valuation Report for This Property
The Home Valuation Report is an in-depth analysis detailing your home's value as well as a comparison with similar homes in the area
Home Values in the Area
Average Home Value in this Area
Purchase History
| Date | Buyer | Sale Price | Title Company |
|---|---|---|---|
| Beasley Amy P | -- | None Available | |
| Ollar Troy A | $112,000 | -- | |
| Beasley Amy P | $112,650 | -- | |
| Argo Homes Inc | $25,000 | -- | |
| Argo Homes Inc | $25,000 | -- | |
| Kelly Donna Marie | -- | -- | |
| -- | -- | -- |
Source: Public Records
Mortgage History
| Date | Status | Borrower | Loan Amount |
|---|---|---|---|
| Open | Beasley Amy P | $146,520 |
Source: Public Records
Tax History
| Year | Tax Paid | Tax Assessment Tax Assessment Total Assessment is a certain percentage of the fair market value that is determined by local assessors to be the total taxable value of land and additions on the property. | Land | Improvement |
|---|---|---|---|---|
| 2025 | $426 | $44,975 | $8,800 | $36,175 |
| 2024 | $426 | $32,950 | $6,825 | $26,125 |
| 2023 | $426 | $32,950 | $0 | $0 |
| 2022 | $380 | $29,450 | $6,825 | $22,625 |
| 2021 | $380 | $29,450 | $6,825 | $22,625 |
| 2020 | $402 | $29,450 | $6,825 | $22,625 |
| 2019 | $401 | $26,700 | $6,825 | $19,875 |
| 2018 | $401 | $26,575 | $6,825 | $19,750 |
| 2017 | $401 | $26,575 | $6,825 | $19,750 |
| 2016 | $405 | $25,200 | $6,825 | $18,375 |
| 2015 | $405 | $25,200 | $6,825 | $18,375 |
| 2014 | $405 | $25,200 | $6,825 | $18,375 |
Source: Public Records
Map
Nearby Homes
- 0 Hayslett Rd
- 935 Lakeview Dr
- 10 Post Oak Cove
- 0 Fisherville Rd Unit 10210138
- 415 Key Rd
- 14285 Tennessee 196
- 260 Lake Pointe Cove
- 570 Wildwood Rd
- 170 Casey Dr
- 9195 Hwy 196 Hwy
- 9125 Hwy 196 Hwy
- 3290 Raleigh Lagrange Dr
- 2665 Raleigh Lagrange Dr
- 25 Kirkhill Ln
- 14955 Hwy 196 Hwy
- 2230 Jenkins Dr
- 385 Monterey Dr
- 240 Big Bell Loop
- 3890 Mebane Rd
- 925 Belle Meade Dr
Your Personal Tour Guide
Ask me questions while you tour the home.